Weekly Waves: GBP/USD, US30 and Bitcoin

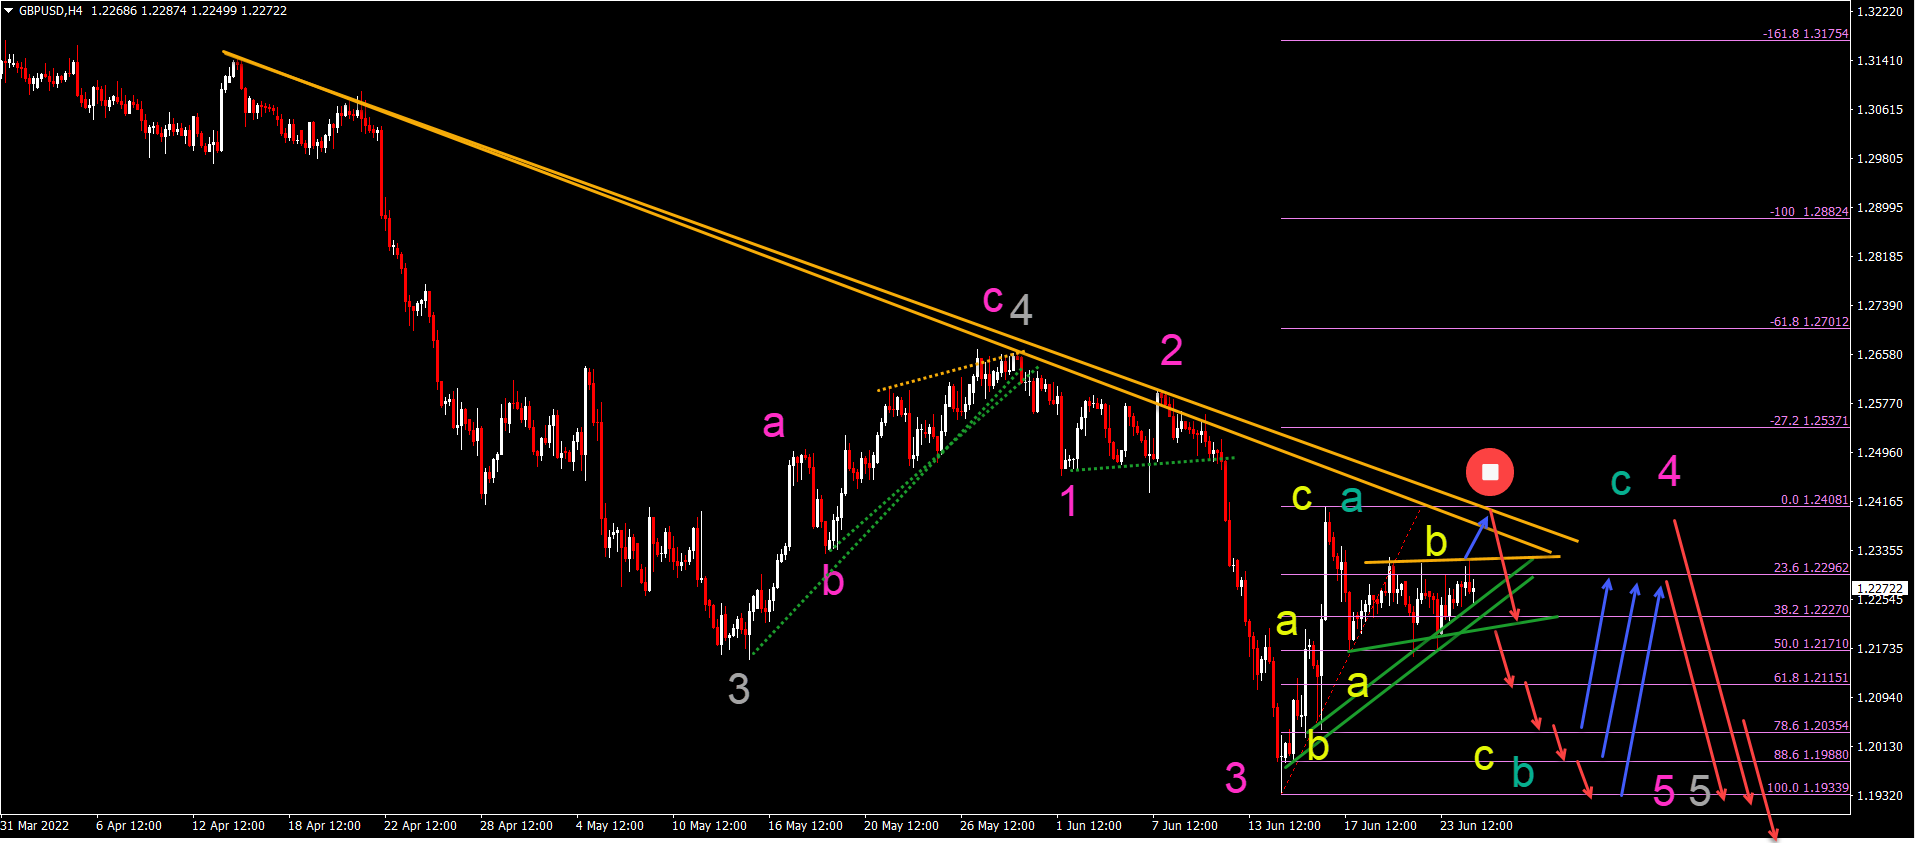
GBP/USD bullish price swing in Wave 4?
The GBP/USD has made a 500 pip bullish price swing. But despite the large move up, price action is technically still in a downtrend. Let’s review:
-
The GBP/USD broke below the round level of 1.20 but the bulls regained control quickly and unexpectedly.
-
The bullish price swing however seems to consist of an internal ABC pattern (yellow) within the wave A (green).
-
Our Elliott Wave analysis therefore favors a bearish ABC (yellow) within the wave B (green).
-
The wave B (green) could go to the 78.6%, 88.6% or even previous bottom (100%).
-
A larger bullish ABC (green) correction could complete a wave 4 (pink). This remains valid as long as price action stays below the bottom of wave 1.
-
A break above the 1.2475-1.25 resistance zone would indicate a potential trend reversal or retracement.
-
A new downtrend could aim for targets at 1.1850, 1.1750, 1.1650, and 1.15.
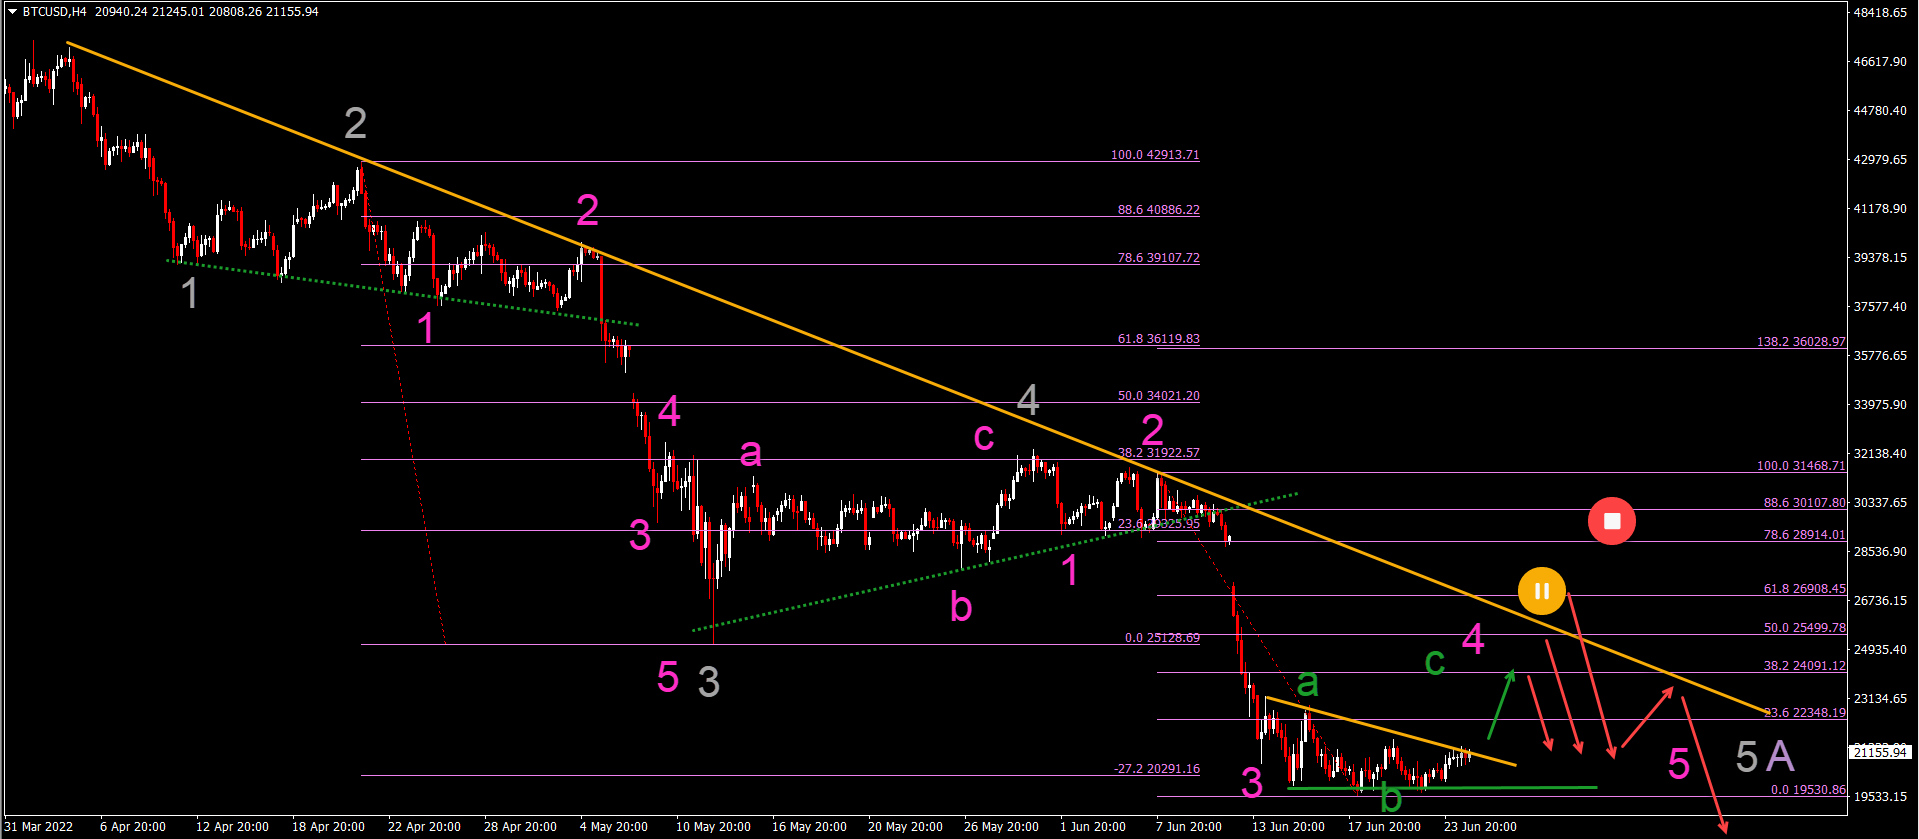
BTC/USD struggles to find bullish legs?
Bitcoin (BTC/USD) has reached the -27.2% Fibonacci target around the round psychological level of $20,000. Let’s review what is next for the main crypto currency:
-
The BTC/USD is trying to build a bullish retracement but the price action remains hesitant to pull away from the 20k area.
-
It seems though that price action will be completing a bullish ABC (green) within a wave 4 (pink) choppy correction.
-
The most logical target for the wave C (green) of wave (pink) is the 38.2% Fibonacci retracement level but sometimes price action can retrace deeper.
-
A bullish break above the trend line (orange) and 78.6% Fibonacci level makes the current bearish Elliott Wave analysis unlikely and invalidate.
-
A bullish correction that is choppy and lengthy is typical for a wave 4 and would confirm this expected wave pattern.
-
The bearish target for the wave 5 (pink) of wave 5 (gray) of wave A (purple) is around $17,500. A larger wave B pattern could emerge of a larger ABC once the wave A is completed.
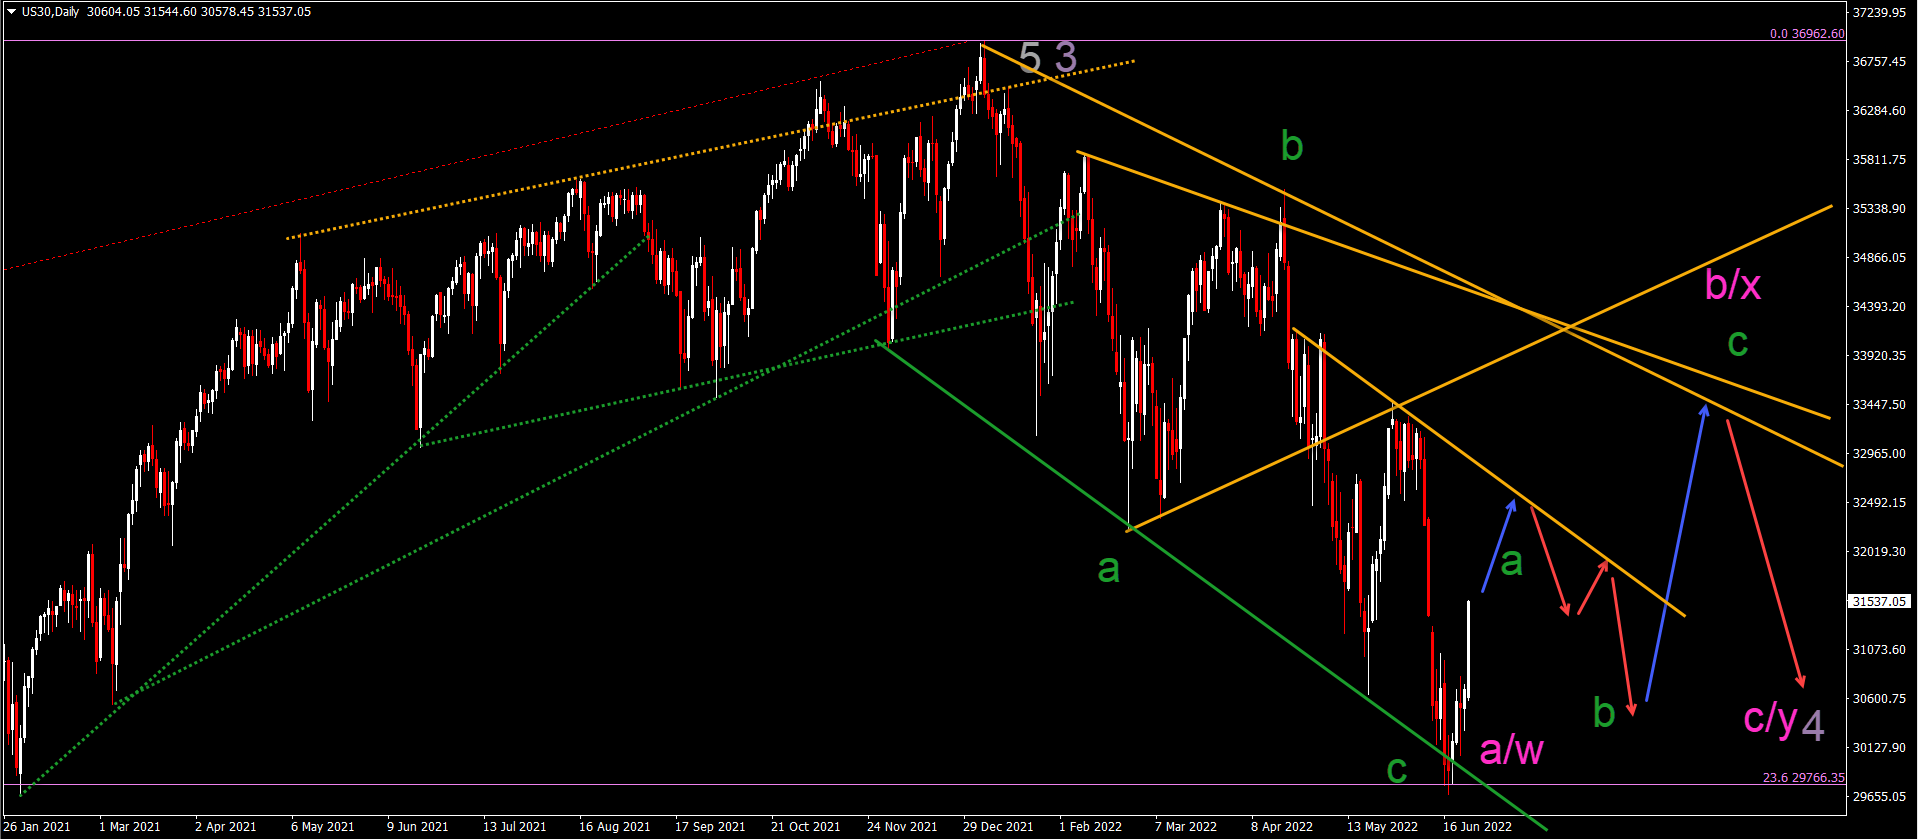
US30 large whipsaw but bearish remain in control
The US30 made a strong bullish bounce at the 23.6% Fibonacci retracement level:
-
The US30 bullish bounce could indicate a potential larger bullish correction.
-
Price action, however, remains in a downtrend and the bullish bounce is probably a retracement.
-
The bearish correction has probably completed a wave A or W (pink) of a larger ABC or WXY (pink) correction.
-
If price action places a higher low, then a bullish ABC (green) within wave B or X (pink) could see price action move towards the resistance trend lines (orange).
-
A bearish bounce and downtrend continuation is expected to emerge within a large and complex wave 4 (blue).
Author

Chris Svorcik
FS method
Chris Svorcik is a trader, analyst, and educator with over 15 years of experience in financial markets, specializing in moving averages, market structure, and price patterns.


