USD/CAD ends the bullish correction
Today, the calendar is pretty empty and the most important data will come from Canada, where we’ll find out the latest retail sales numbers. So, let’s analyse the situation on the USDCAD, which is really technical.
We’ll focus on the weekly chart, so there’s definitely something for swing traders and long-term investors.
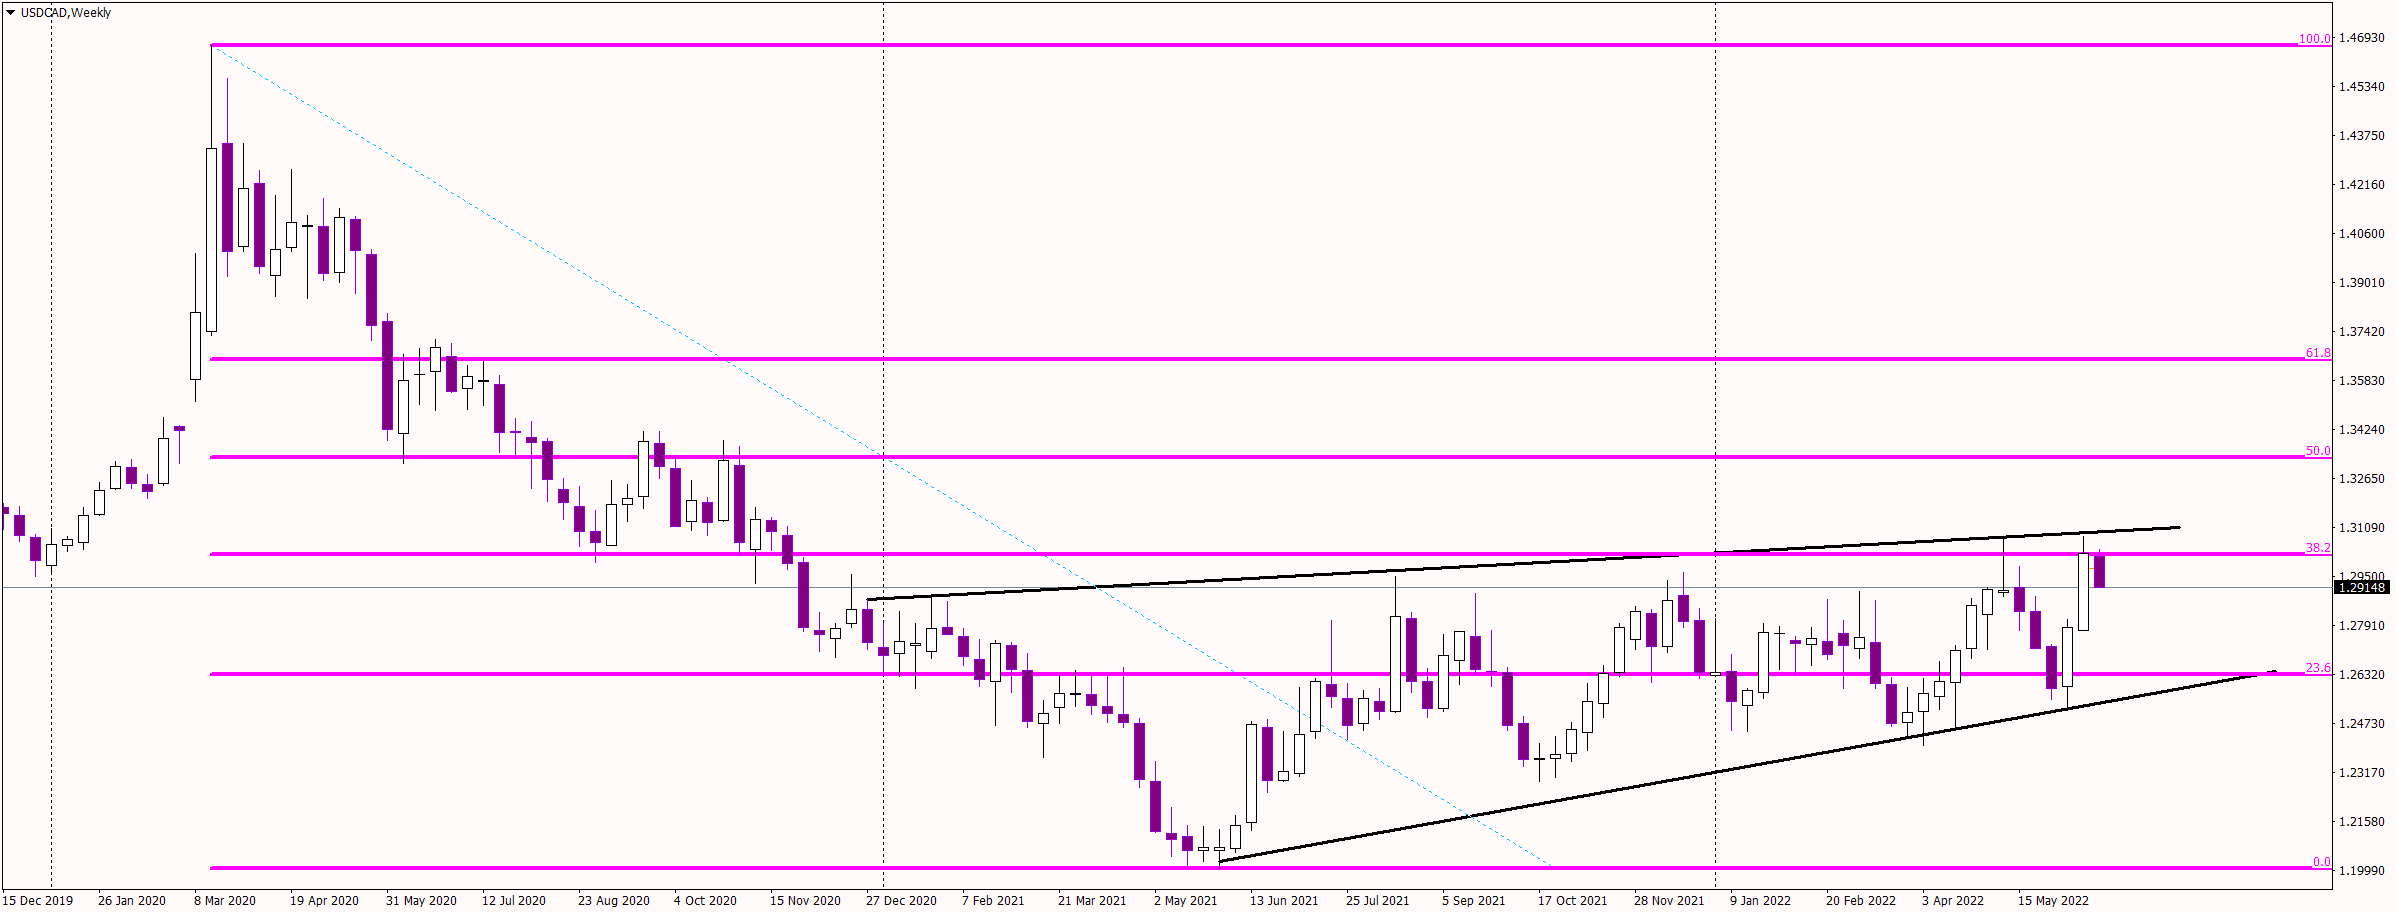
From March 2020 until May 2021, the price of USDCAD was in a deep-down trend. Since May, we’ve been experiencing a bullish correction. A correction is shaped like a wedge, so it promotes the breakout to the downside, and as a consequence a continuation of the main bearish trend. What’s interesting here is that most recently, the price hit the 38,2% Fibonacci, which should never be ignored. The USDCAD tested that level and bounced. At the same time, we tested the upper line of the wedge. Additionally, we did this for a second time this year, which opens up a possibility for a double top.
All that leads me to thinking that the next few weeks will be bearish for USDCAD. This trade has a great risk to reward ratio, and the potential target for the current drop is on the 23,6% Fibonacci, so still far away. The negative sentiment will be cancelled when the price comes back above the 38,2% Fibonacci, but chances for that happening are rather limited.
Author

Tomasz Wisniewski
Axiory Global Ltd.
Tomasz was born in Warsaw, Poland on 25th October, 1985.


