|premium|

USD/JPY Forecast: Risk of a bearish extension once below 106.35

USD/JPY Current Price: 106.60

  • Rising US Treasury yields underpinned USD/JPY in spite of the broad dollar’s weakness.
  • Japan’s Q2 Gross Domestic Product expected to have fallen a record 27.2%.
  • USD/JPY at risk of falling further after being unable to surpass the 107.00 level.
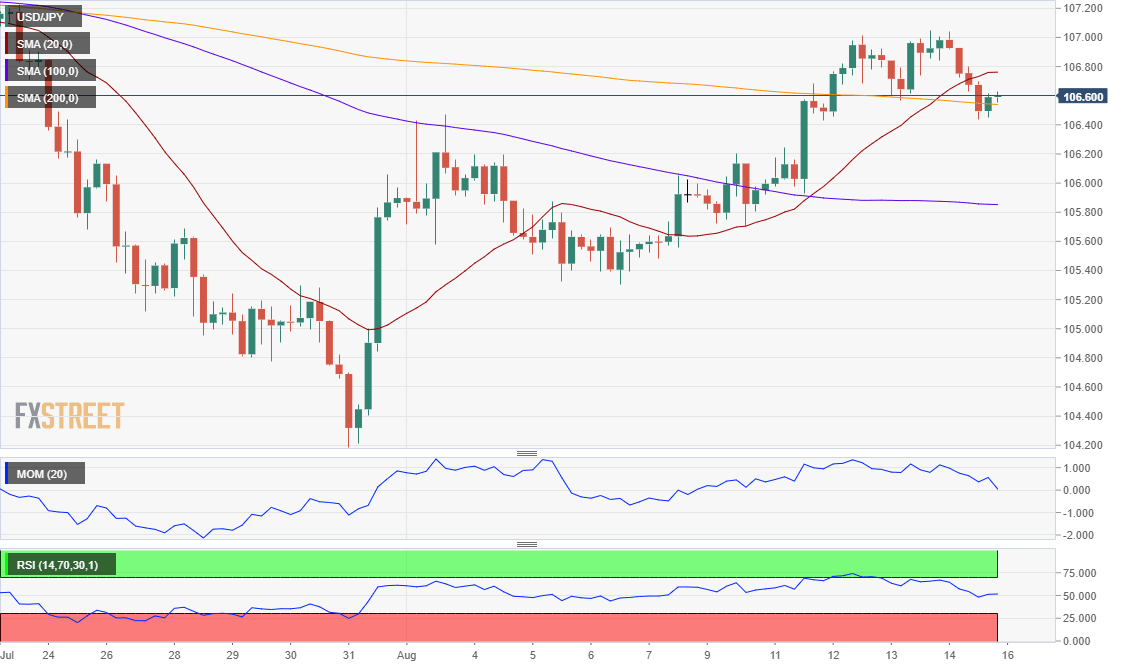
The USD/JPY pair advanced these days, despite the broad dollar’s weakness, amid a substantial recovery in US Treasury yields. The pair surged to 107.04 mid-week, its highest since this August, to settle around 106.60. The pair fell in the last trading day of the week after it failed to take the 107.00 area for a third consecutive day. Equities traded with a soft tone, with Wall Street ending mixed yet little changed on a daily basis. As per Treasury yields, they remained flat amid mixed US economic data.

The JPY was also underpinned by Japanese data, as the Tertiary Industry Index recovered to 7.9% in June from -2.9% in the previous month. During the upcoming Asian session, the country will publish the preliminary estimate of Q2 GDP, with the economy seen contracting a record 27.2% in the three months to June, down from -2.2% in Q1. The country will also publish June Industrial Production, previously at -17.7% YoY and Capacity Utilization, previously at -11.6% MoM.

USD/JPY short-term technical outlook

The daily chart for the USD/JPY pair shows that its weekly rally stalled a few pips below a directionless 100 DMA, but it has spent most of it above a bearish 20 DMA. The Momentum indicator in the mentioned time-frame advanced within positive levels, maintaining its bullish slope, while the RSI is also above its midline, but has already turned south. In the 4-hour chart, the pair broke below its 20 and 200 SMA, while technical indicators crossed their midlines into negative levels before turning flat. The risk of a bearish extension will likely increase on a break below 106.35, the 23.6% retracement of the latest daily advance.

Support levels: 106.35 106.00 105.60

Resistance levels: 107.00 107.45 107.90  

View Live Chart for the USD/JPY

Premium

You have reached your limit of 3 free articles for this month.

Start your subscription and get access to all our original articles.

Subscribe to PremiumSign In

Author

Valeria Bednarik

Valeria Bednarik was born and lives in Buenos Aires, Argentina. Her passion for math and numbers pushed her into studying economics in her younger years.


More from Valeria Bednarik
Share:

Editor's Picks

GBP/USD flat lines around mid-1.3300s vs USD amid Iran tensions

The GBP/USD pair struggles to capitalize on last week's strong move higher and oscillates in a narrow band, around the 1.3350 area during the Asian session on Monday. Moreover, spot prices remain below a technically significant 200-day Simple Moving Average, warranting caution before positioning for an extension of the recent recovery from the 1.3140 zone, or the year-to-date low touched in June.


EUR/USD consolidates below mid-1.1400s as Hormuz risks support safe-haven USD

The EUR/USD pair kicks off the new week on a subdued note and oscillates in a narrow band below mid-1.1400s during the Asian session. Spot prices, however, remain within striking distance of a nearly two-week high, touched last Thursday, amid mixed fundamental cues.


Gold recaptures 21-day SMA, but sellers refuse to give up yet

Gold stalls its recent recovery just above $4,200 early Monday, as the Strait of Hormuz risks lurk. The US Dollar rebounds on renewed haven demand and the USD/JPY advance. Gold finds acceptance above the 21-day SMA, but the daily RSI remains bearish.

Steady recovery in Bitcoin nears key resistance – PUMP and HYPE lead gains

Bitcoin steadies above $63,000 at press time on Monday following a five-day recovery stretch last week, totaling roughly 7% gains. Easing risk-off sentiment in the broader market supports the mild recovery in action, with Pump.fun and Hyperliquid leading gains over the last 24 hours.

Why central banks are loading up on Gold during the current 30% correction
Gold has crashed from $5,500 to $4,000 in five months, marking a decline of almost 30% that has triggered widespread retail panic. However, this correction could present a significant opportunity, driven by an unprecedented market indicator: central bankers and the world's largest asset managers are aggressively buying.
Kevin Warsh offers no policy clues: Why markets still got their answer

Financial markets came to Sintra looking for clues about the Federal Reserve's (Fed) next move. They largely left with confirmation that Fed Chair Kevin Warsh intends to make those clues much harder to find.