![]() Yann Quelenn
Yann Quelenn
Swissquote Bank Ltd
Are you trading today? Read the Forex Trading Strategies for the Day.
EUR/USD
Low volatility.
-
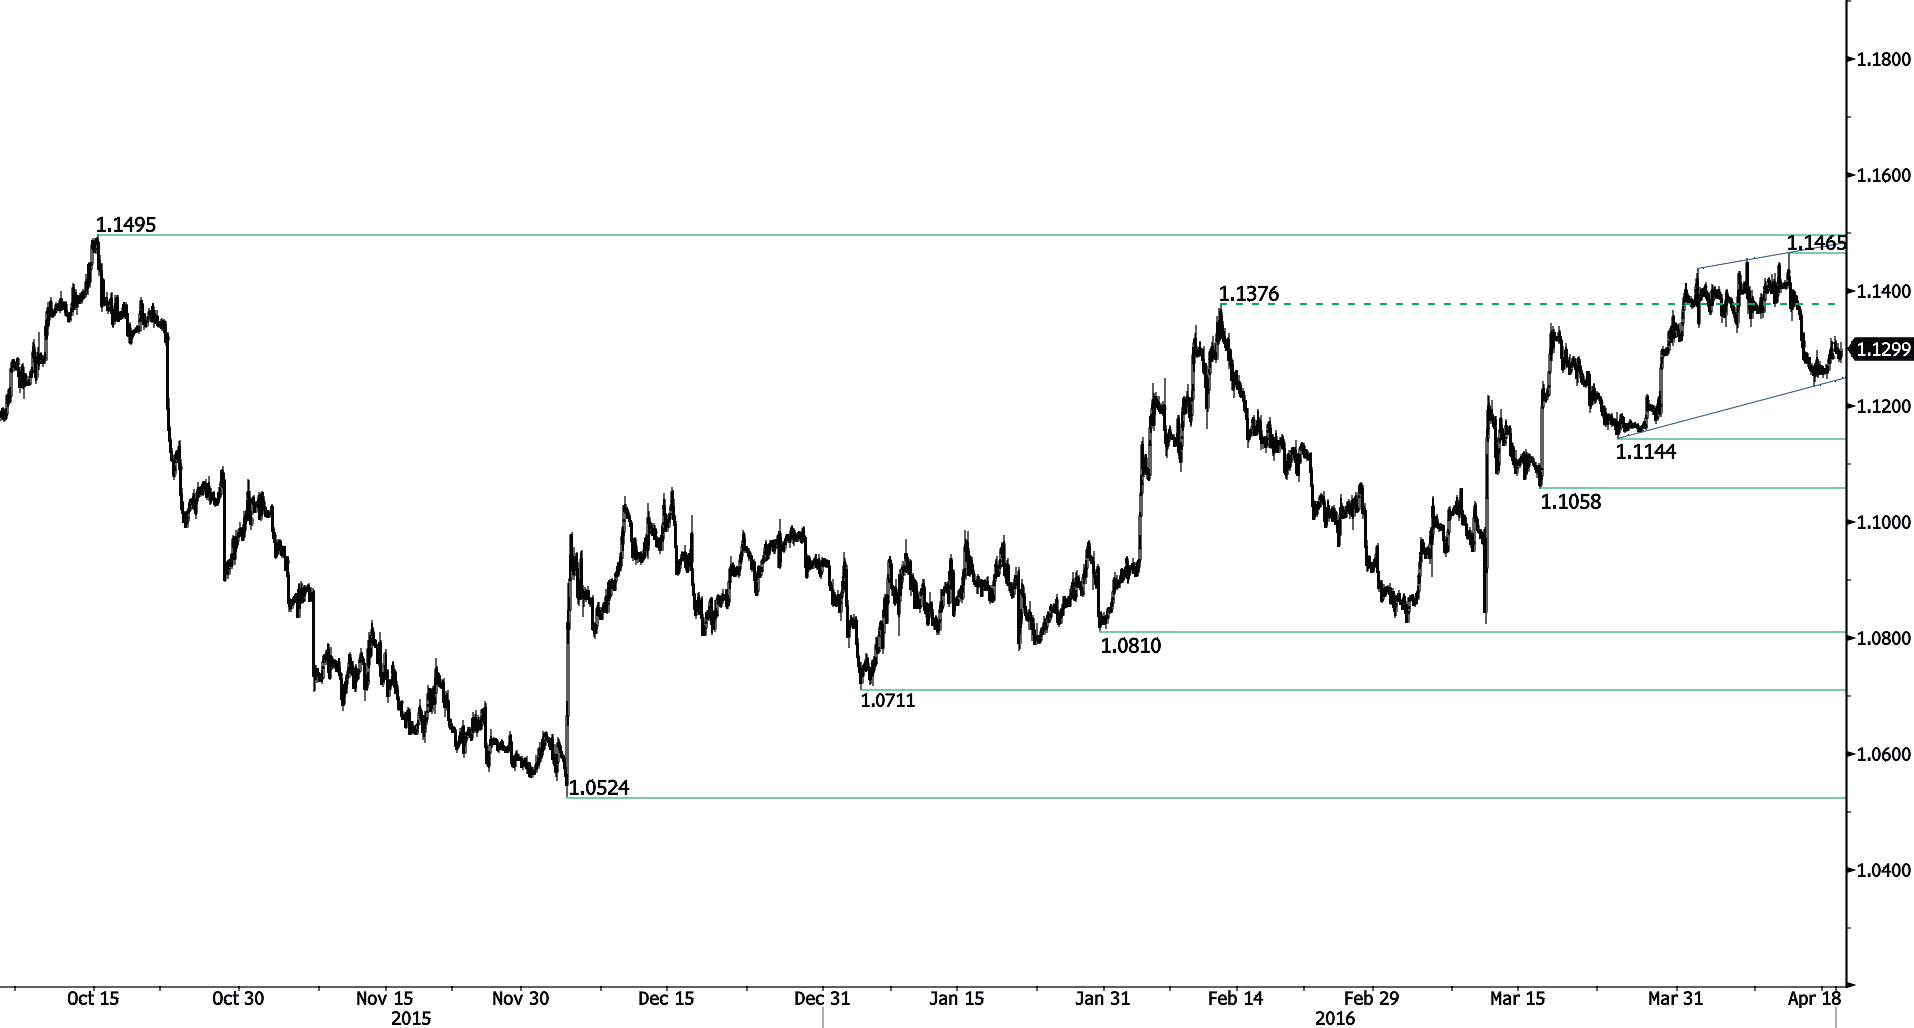
EUR/USD is pushing slightly higher after recent weakening. The pair is moving within an uptrend channel. Hourly support can be found at 1.1144 (24/03/2016 low) and resistance at 1.1465 (12/04/2016 high). Stronger support is located a 1.1058 (16/03/2016 low). Expected to show further increase.
-
In the longer term, the technical structure favours a bearish bias as long as resistance at 1.1746 ( holds. Key resistance is located at 1.1640 (11/11/2005 low). The current technical appreciation implies a gradual increase.
GBP/USD
Volatility decreases.
-
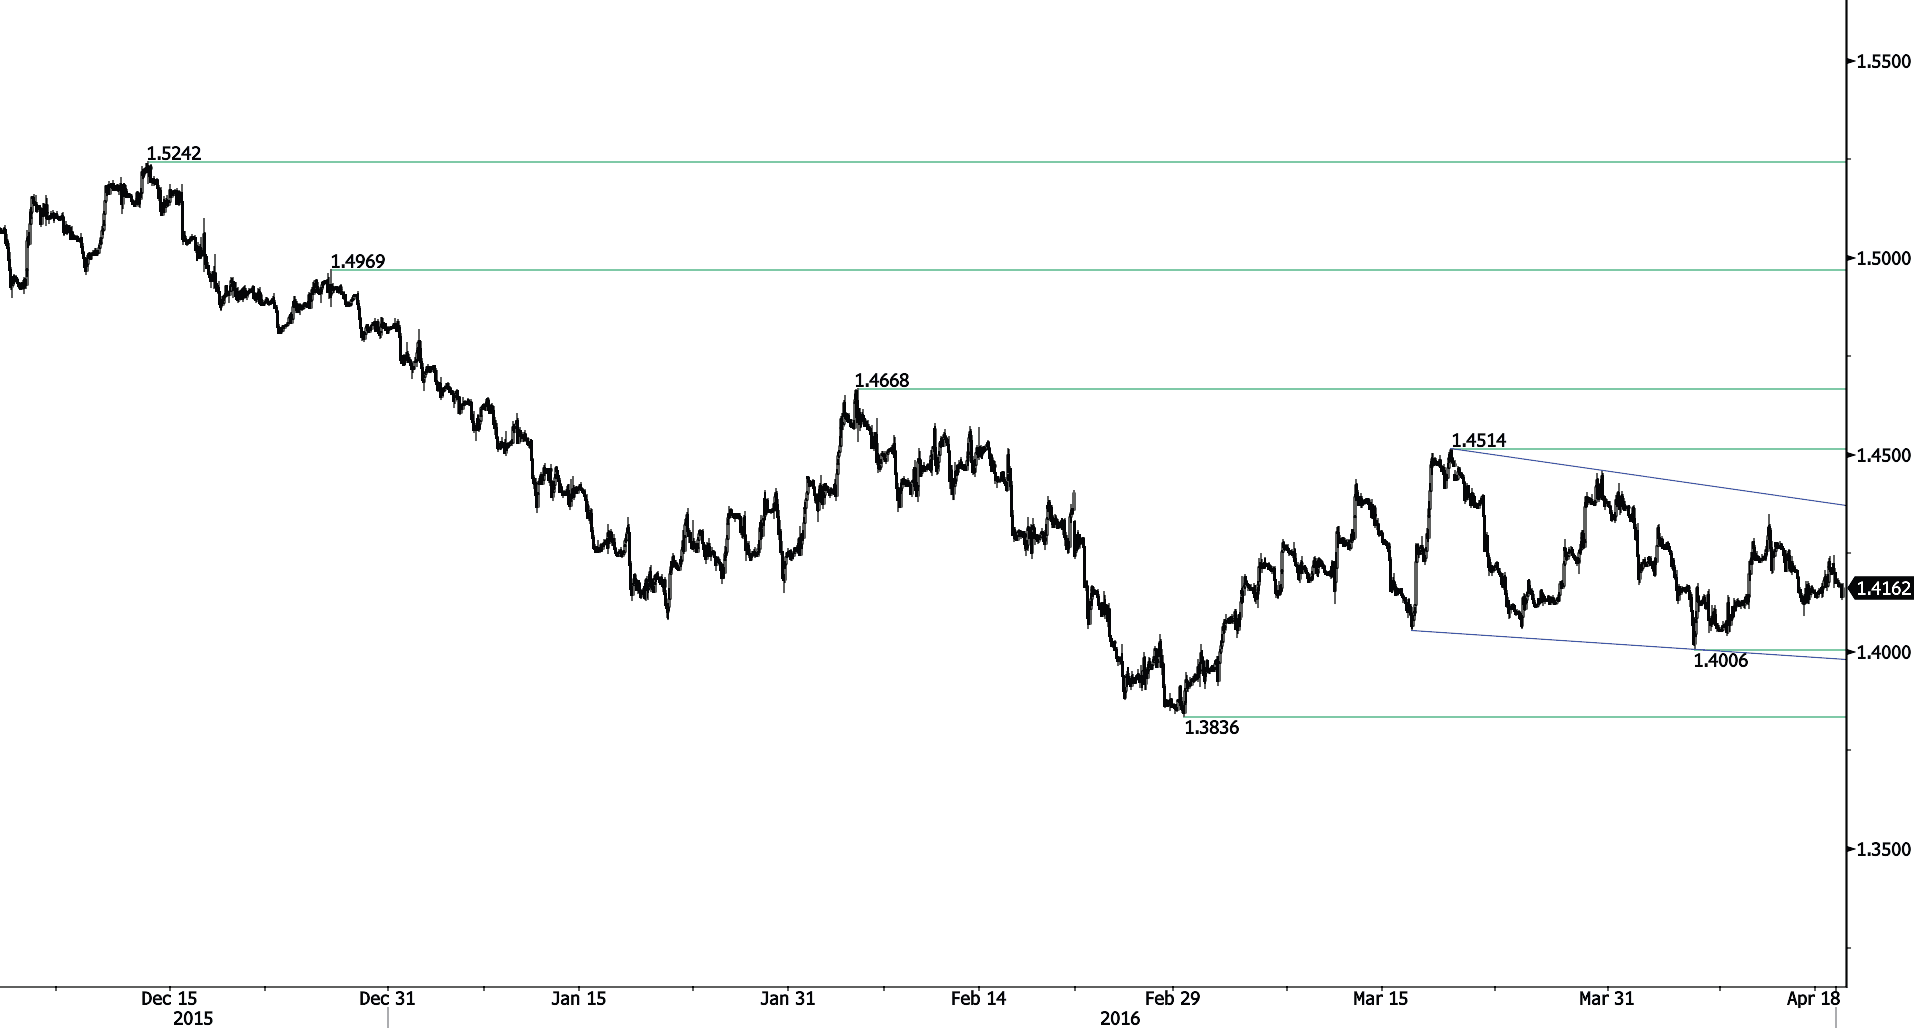
GBP/USD is riding downtrend channel near the hourly support at 1.4006 (04/06/2016 low). Hourly resistance is given at 1.4320 (04/04/2016 high). Expected to show further weakening.
-
The long-term technical pattern is negative and favours a further decline towards key support at 1.3503 (23/01/2009 low), as long as prices remain below the resistance at 1.5340/64 (04/11/2015 low see also the 200 day moving average). However, the general oversold conditions and the recent pick-up in buying interest pave the way for a rebound.
USD/JPY
Monitoring support area around 108.00.
-
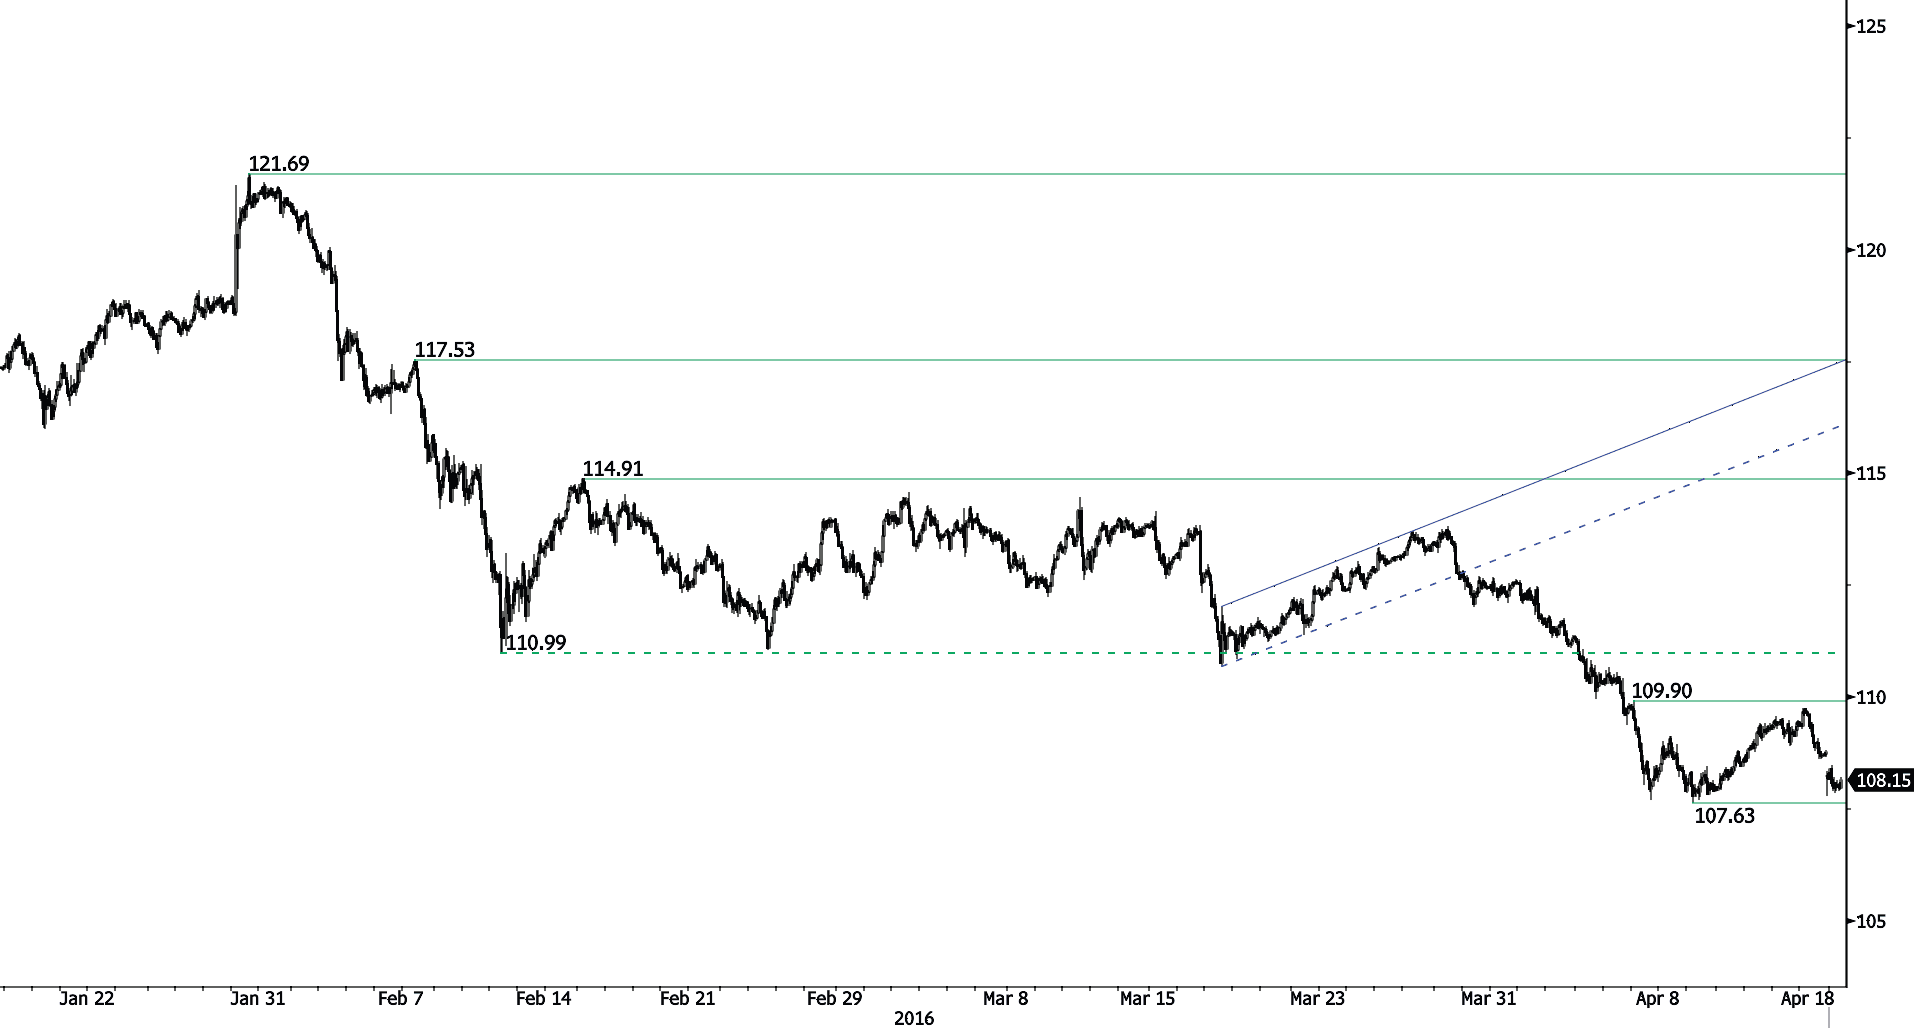
USD/JPY is now back to bearish and the pair is now heading toward hourly support at 107.68 (07/04/2016 low). Hourly resistance can be found at 109.90 (07/04/2016 high). Short-term selling pressures are still on. Expected to show further weakening.
-
We favour a long-term bearish bias. Support at 105.23 (15/10/2014 low) is on target. A gradual rise towards the major resistance at 135.15 (01/02/2002 high) seems now less likely. Another key support can be found at 105.23 (15/10/2014 low).
USD/CHF
Consolidating inside downtrend channel.
-
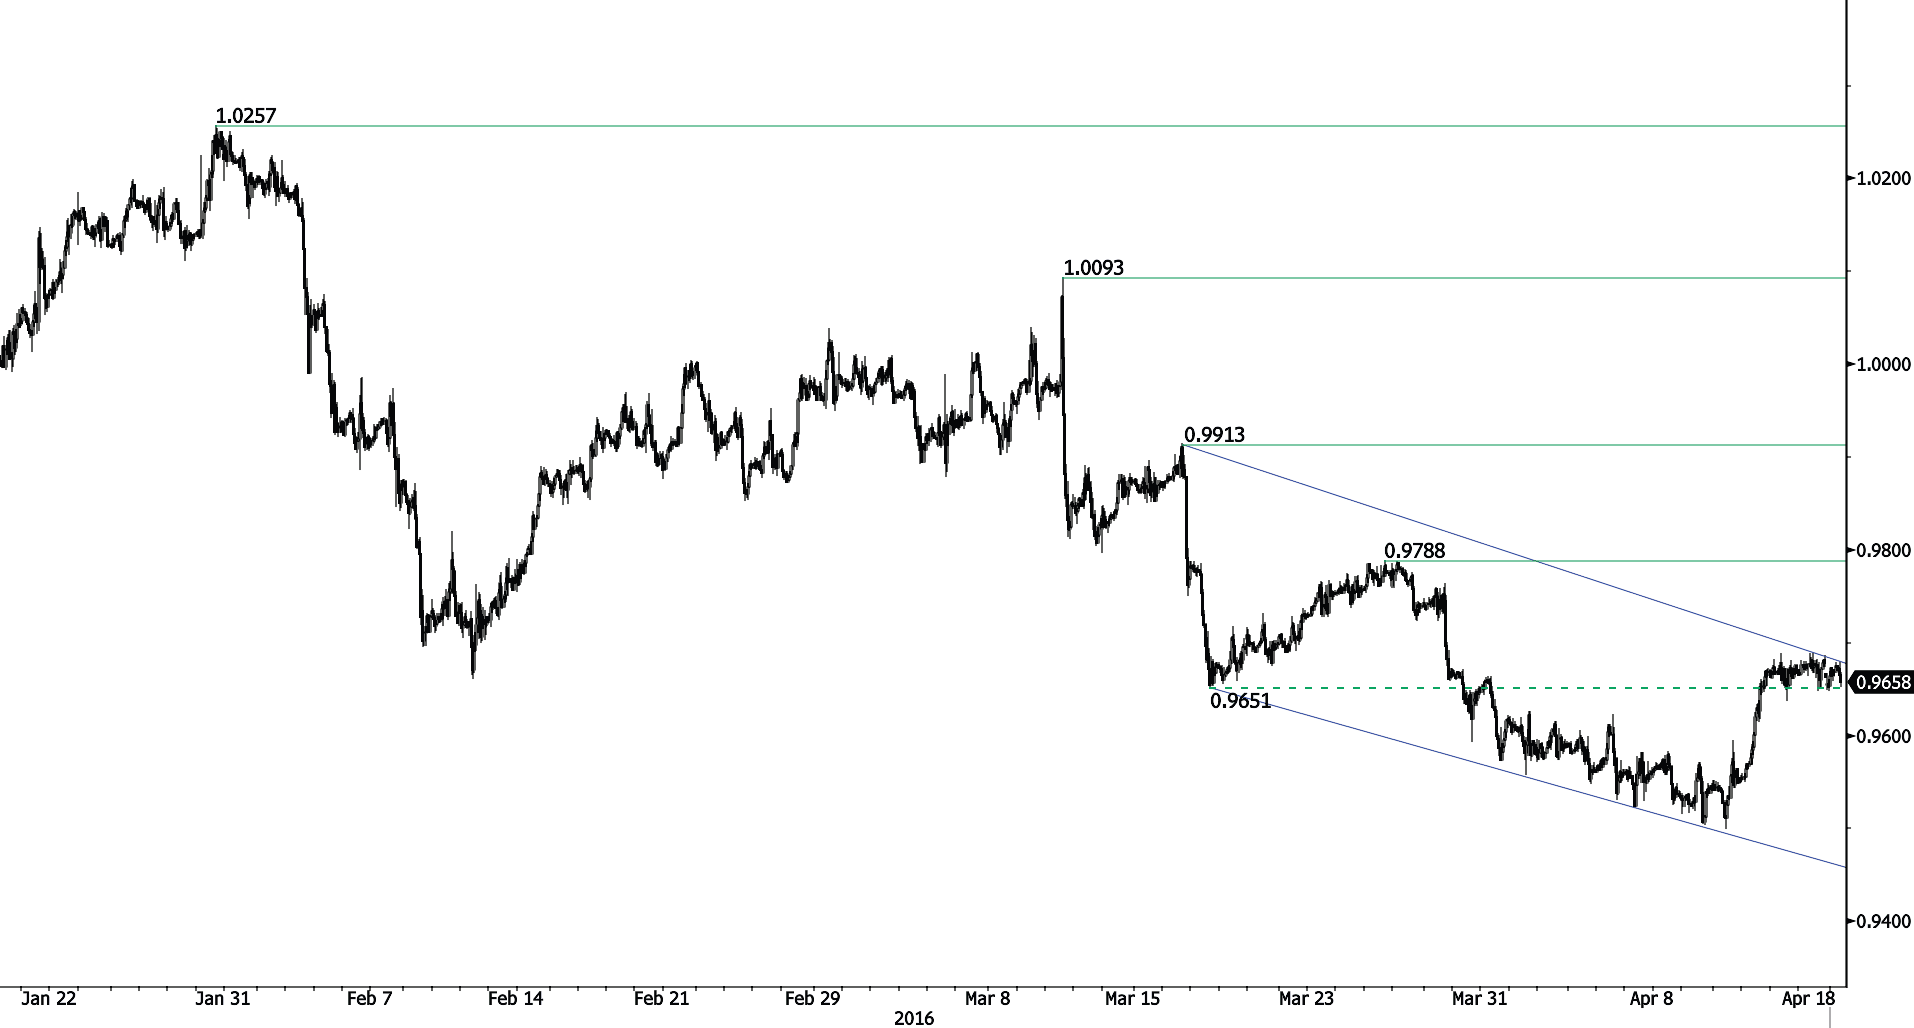
USD/CHF is moving sideways without massive volatility. Hourly support can be found at 0.9499 (12/04/2016 low). Hourly resistance is located by upper bound of the downtrend channel and by 0.9788 (25/03/2016 high). Expected to show further increase as short-term selling pressures do not seem strong.
-
In the long-term, the pair is setting highs since mid-2015. Key support can be found 0.8986 (30/01/2015 low). The technical structure favours a long term bullish bias.
USD/CAD
Bearish momentum is fading.
-
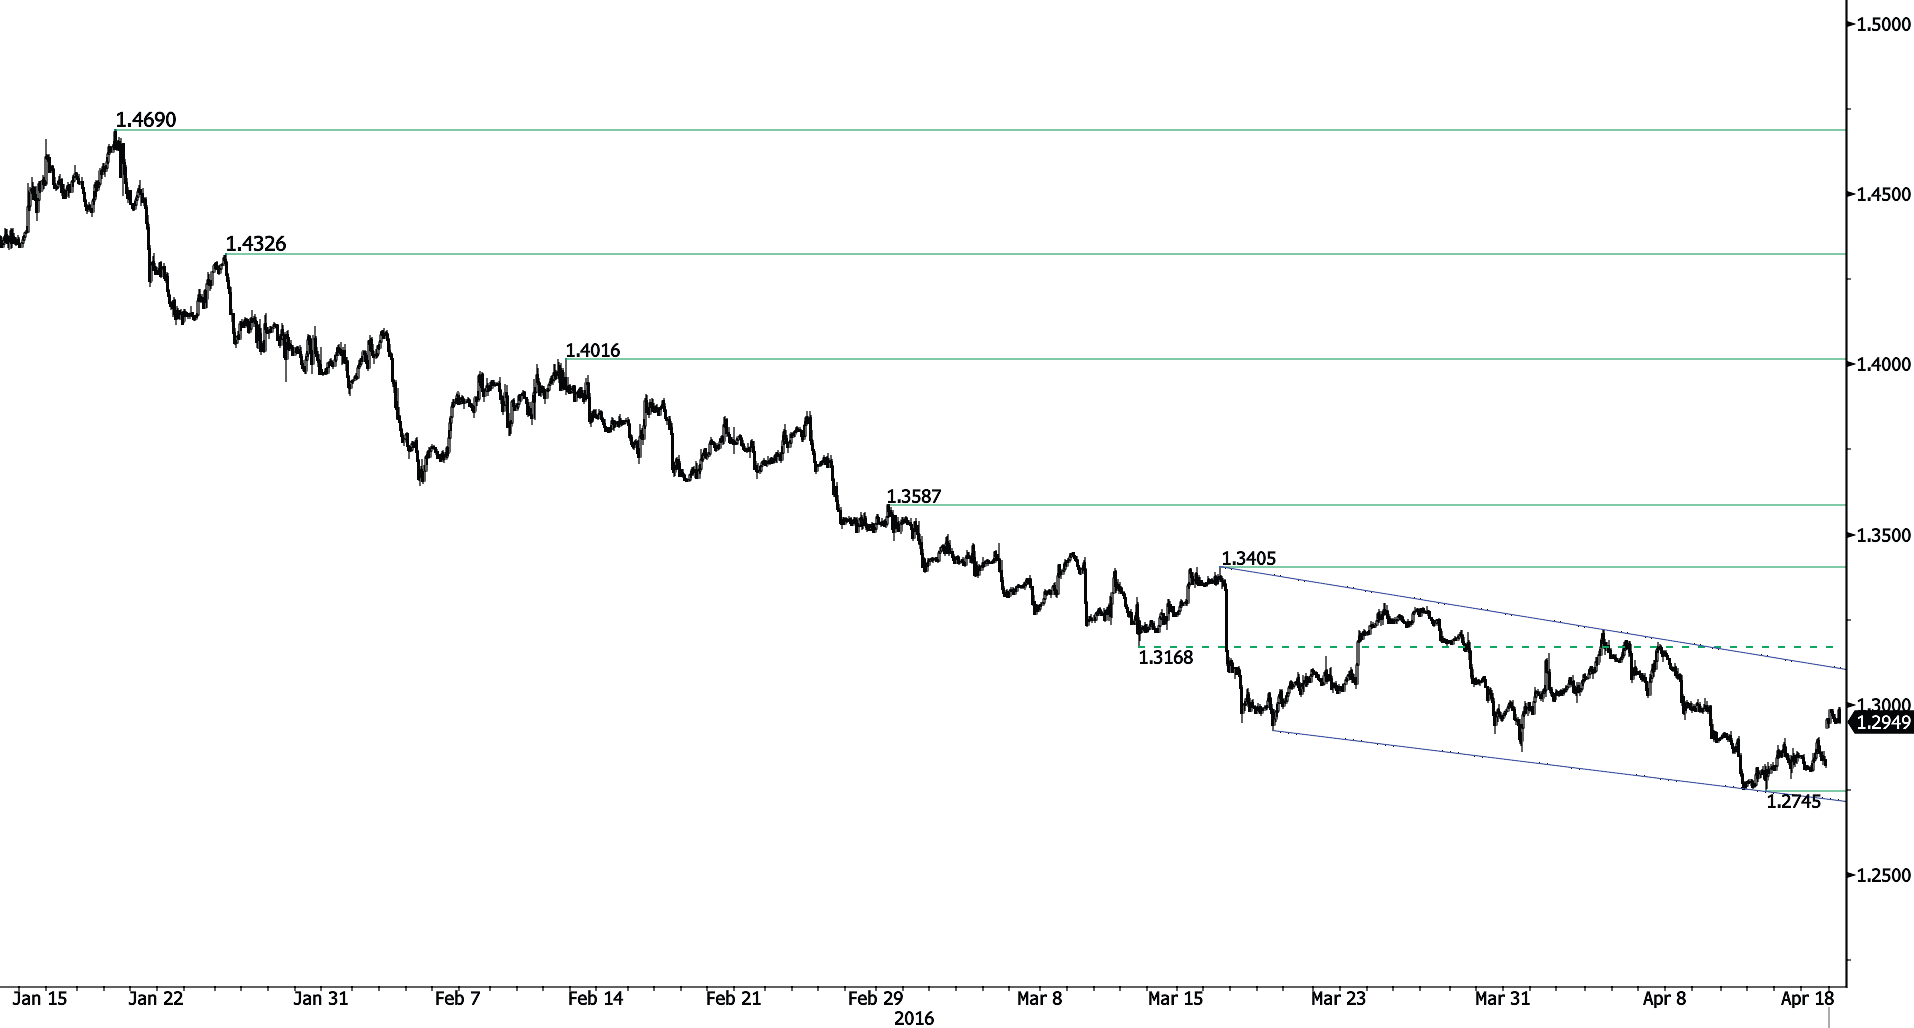
USD/CAD is still riding the short-term downtrend channel, confirming persistent underlying pressures. Hourly support can be found at 1.2745 (13/04/2016 low). Hourly resistance is given at 1.2897 (14/04/2016 high). Expected to weaken further lower on support implied by the lower bound of the downtrend channel.
-
In the longer term, the pair is now trading well below the 200-day moving average. Strong resistance is given at 1.4948 (21/03/2003 high). Stronger support can be found at 1.1731 (06/01/2015 low).
AUD/USD

Bearish retracement.
-
AUD/USD recovery bounce is gaining strength despite ongoing bearish retracement. Resistance is located at 0.7737 (31/03/2016 high) has been broken. Hourly support is given at 0.7555 (rising trendline) then 0.7415 (16/03/2016 low). Buying pressures remains nonetheless important as long as the pair remains above 0.7415.
-
In the long-term, we are waiting for further signs that the current downtrend is ending. Key supports stand at 0.6009 (31/10/2008 low) . A break of the key resistance at 0.8295 (15/01/2015 high) is needed to invalidate our long-term bearish view. In addition, we still note that the pair is now above the 200-dma which confirms our view that buying pressures are increasing.
EUR/CHF
Moving sideways.
-
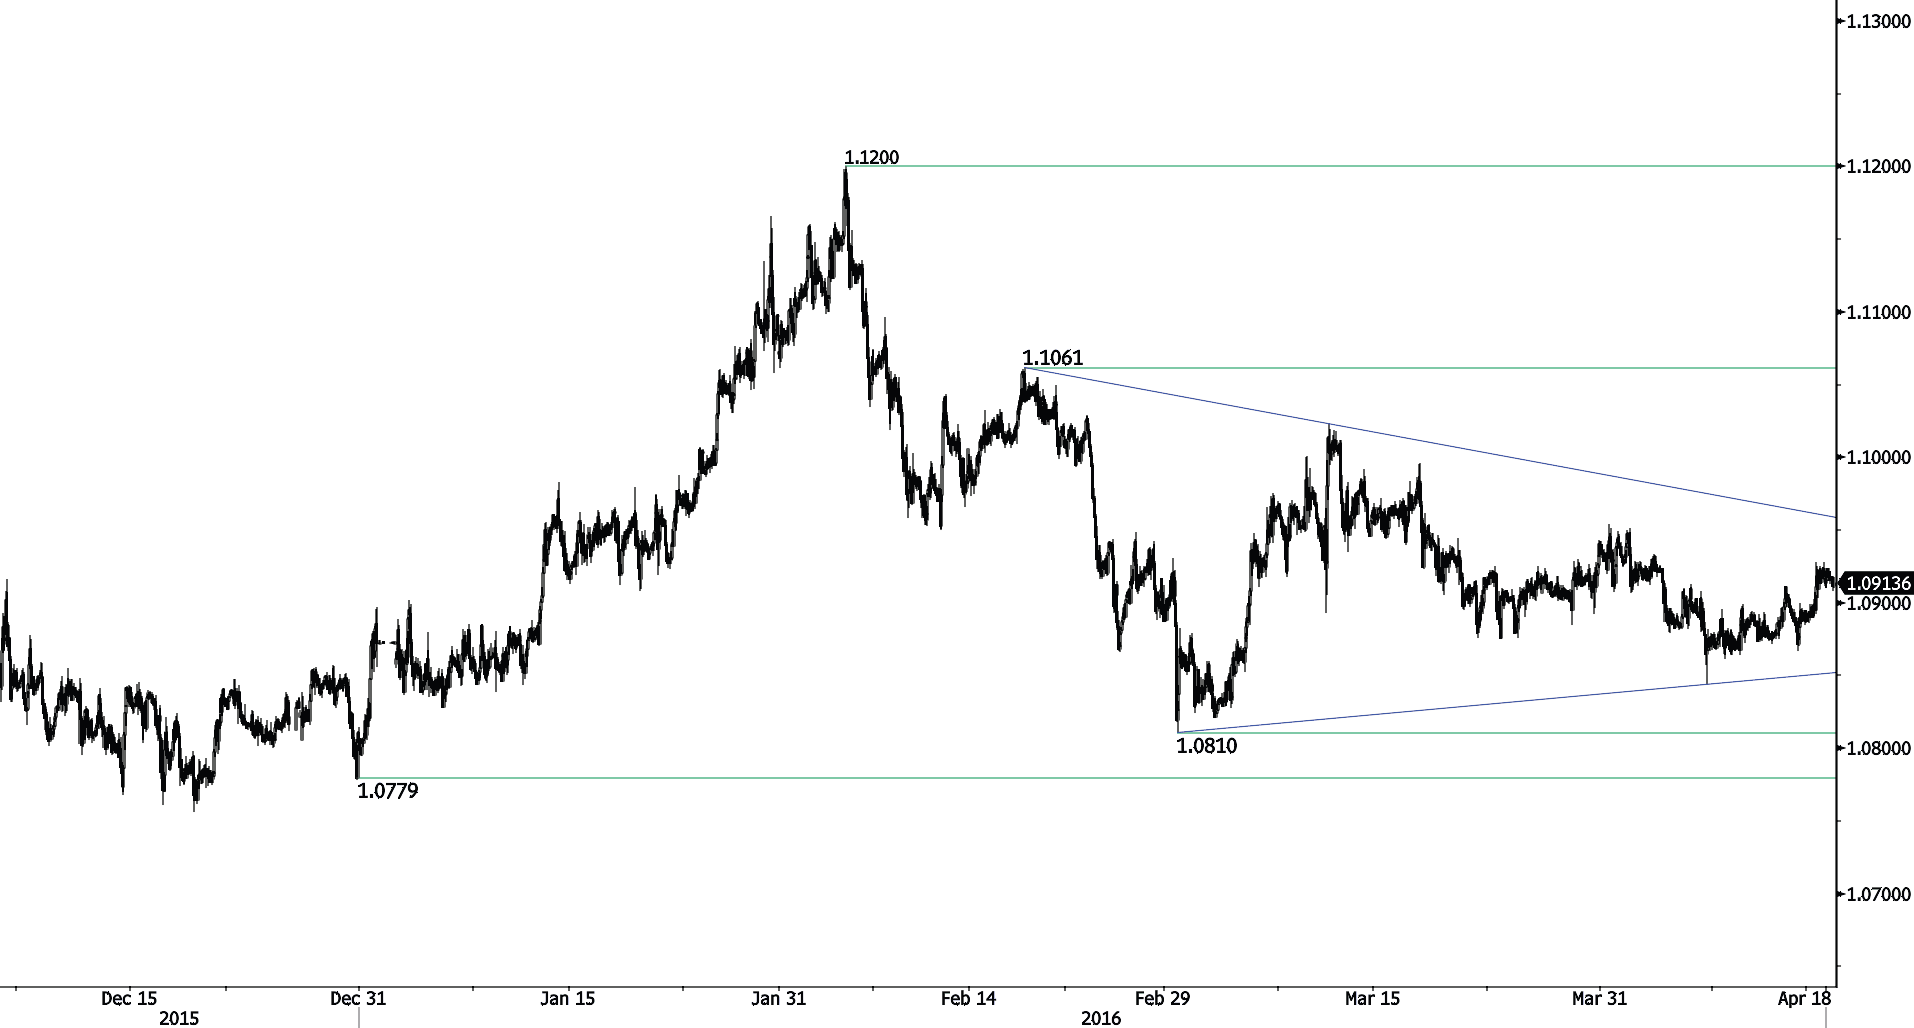
EUR/CHF has not a strong momentum. Hourly support can be found at 1.0863 (23/03/2016 low) while hourly resistance is given at 1.1061 (17/02/2016 high). Expected to show continued consolidation.
-
In the longer term, the technical structure remains positive. Resistance can be found at 1.1200 (04/02/2015 high). Yet,the ECB's QE programme is likely to cause persistent selling pressures on the euro, which should weigh on EUR/CHF. Supports can be found at 1.0184 (28/01/2015 low) and 1.0082 (27/01/2015 low).
EUR/JPY
Bearish momentum.
-
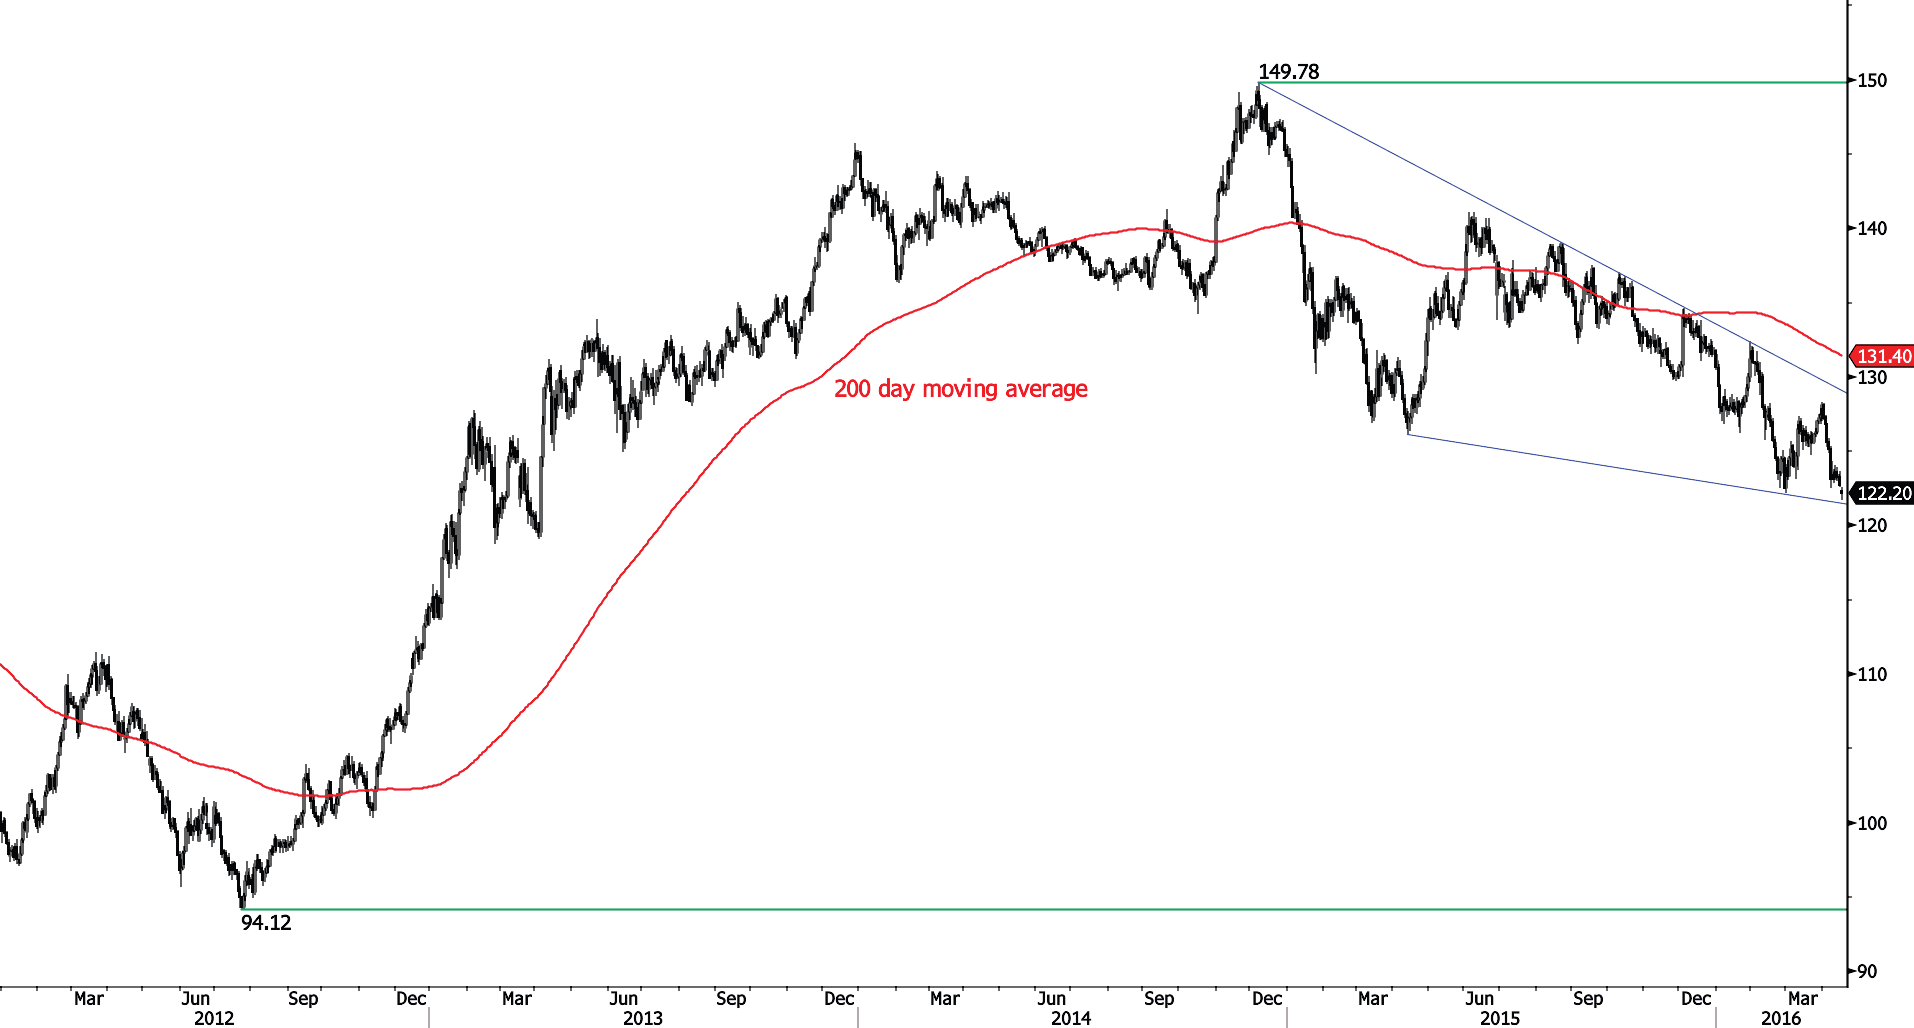
EUR/JPY is weaker. Strong support at 122.11 (01/03/2016 low) has been broken. Hourly resistance can be found at 124.67 (07/04/2016 reaction high). Expected to show further weakness.
-
In the longer term, the technical structure validates a medium-term succession of lower highs and lower lows. As a result, the resistance at 149.78 (08/12/2014 high) has likely marked the end of the rise that started in July 2012. Strong support is given at 118.73 (25/02/2013 low). A key resistance can be found at 141.06 (04/06/2015 high).
EUR/GBP
Failed to reach 0.8000.
-
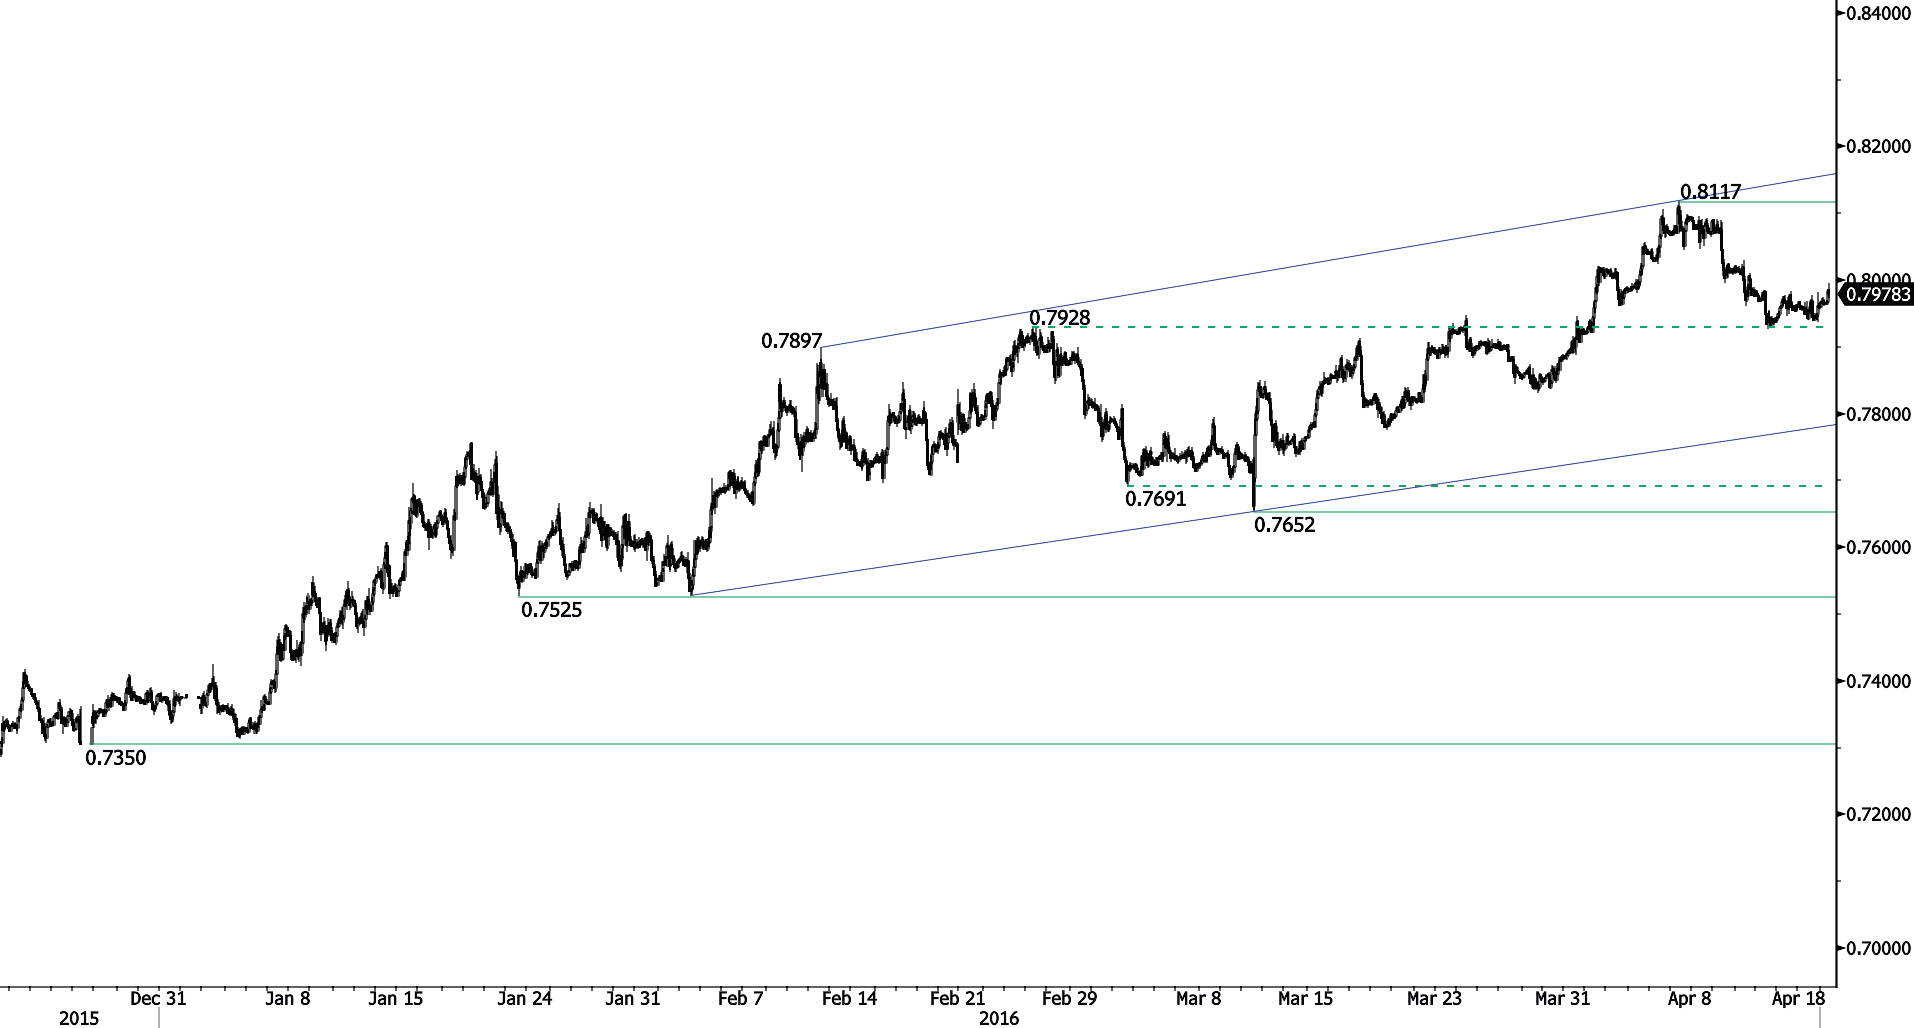
EUR/GBP is trading below 0.8000. Yet, ongoing momentum is still lively. Hourly support can be found at 0.7925 (13/04/2016 low). Hourly resistances for a short-term bounce can be found at 0.8117 (07/04/2016 high).
-
In the long-term, the pair is currently recovering from recent lows in 2015. The technical structure suggests a growing upside momentum. The pair is trading well above its 200 DMA. Strong resistance can be found at 0.8815 (25/02/2013 high).
GOLD (in USD)
Moving sideways.
-
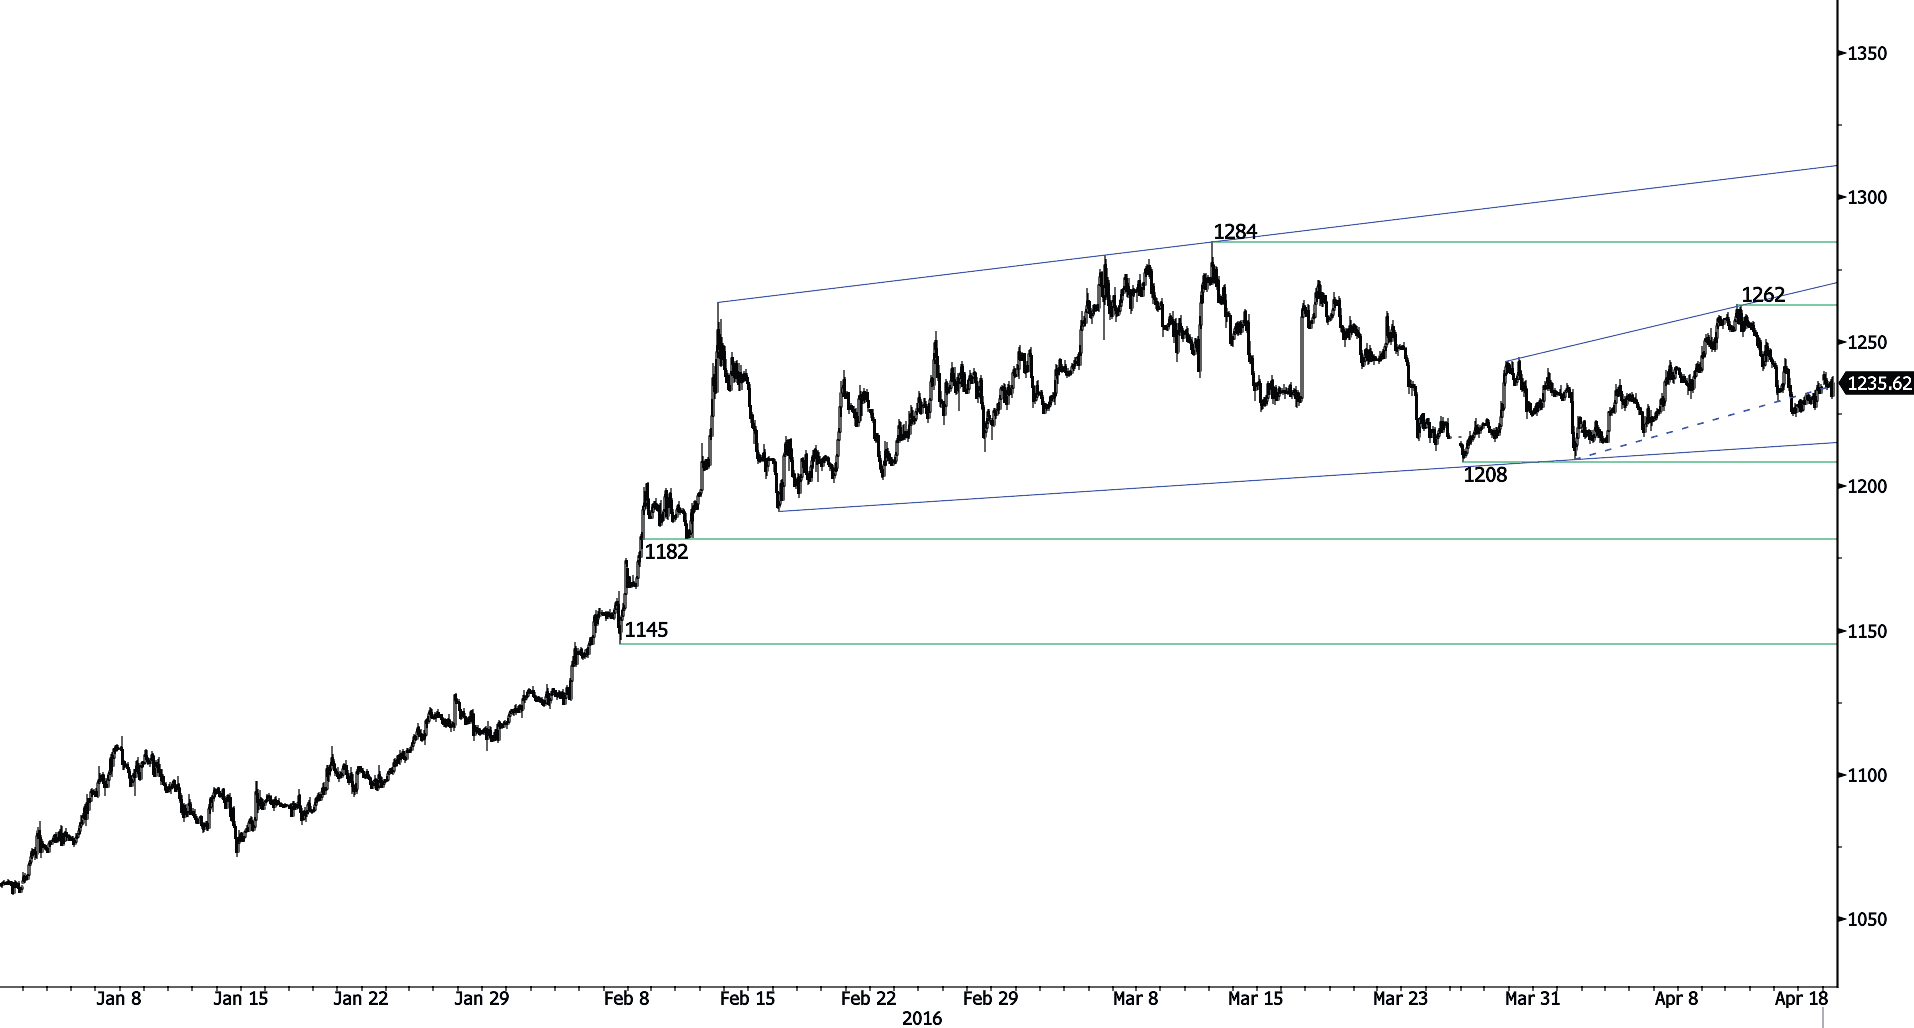
Gold is lying in a short-term range-bound. Support is given at 1208 (28/03/2016). Resistance is given at 1262 (12/04/2016 high). A break of support at 1182 (08/02/2016 low) is necessary to confirm deeper selling pressures.
-
In the long-term, the technical structure suggests that there is a growing upside momentum. A break of 1392 (17/03/2014) is necessary ton confirm it, A major support can be found at 1045 (05/02/2010 low).
SILVER (in USD)
Lack of momentum.
-
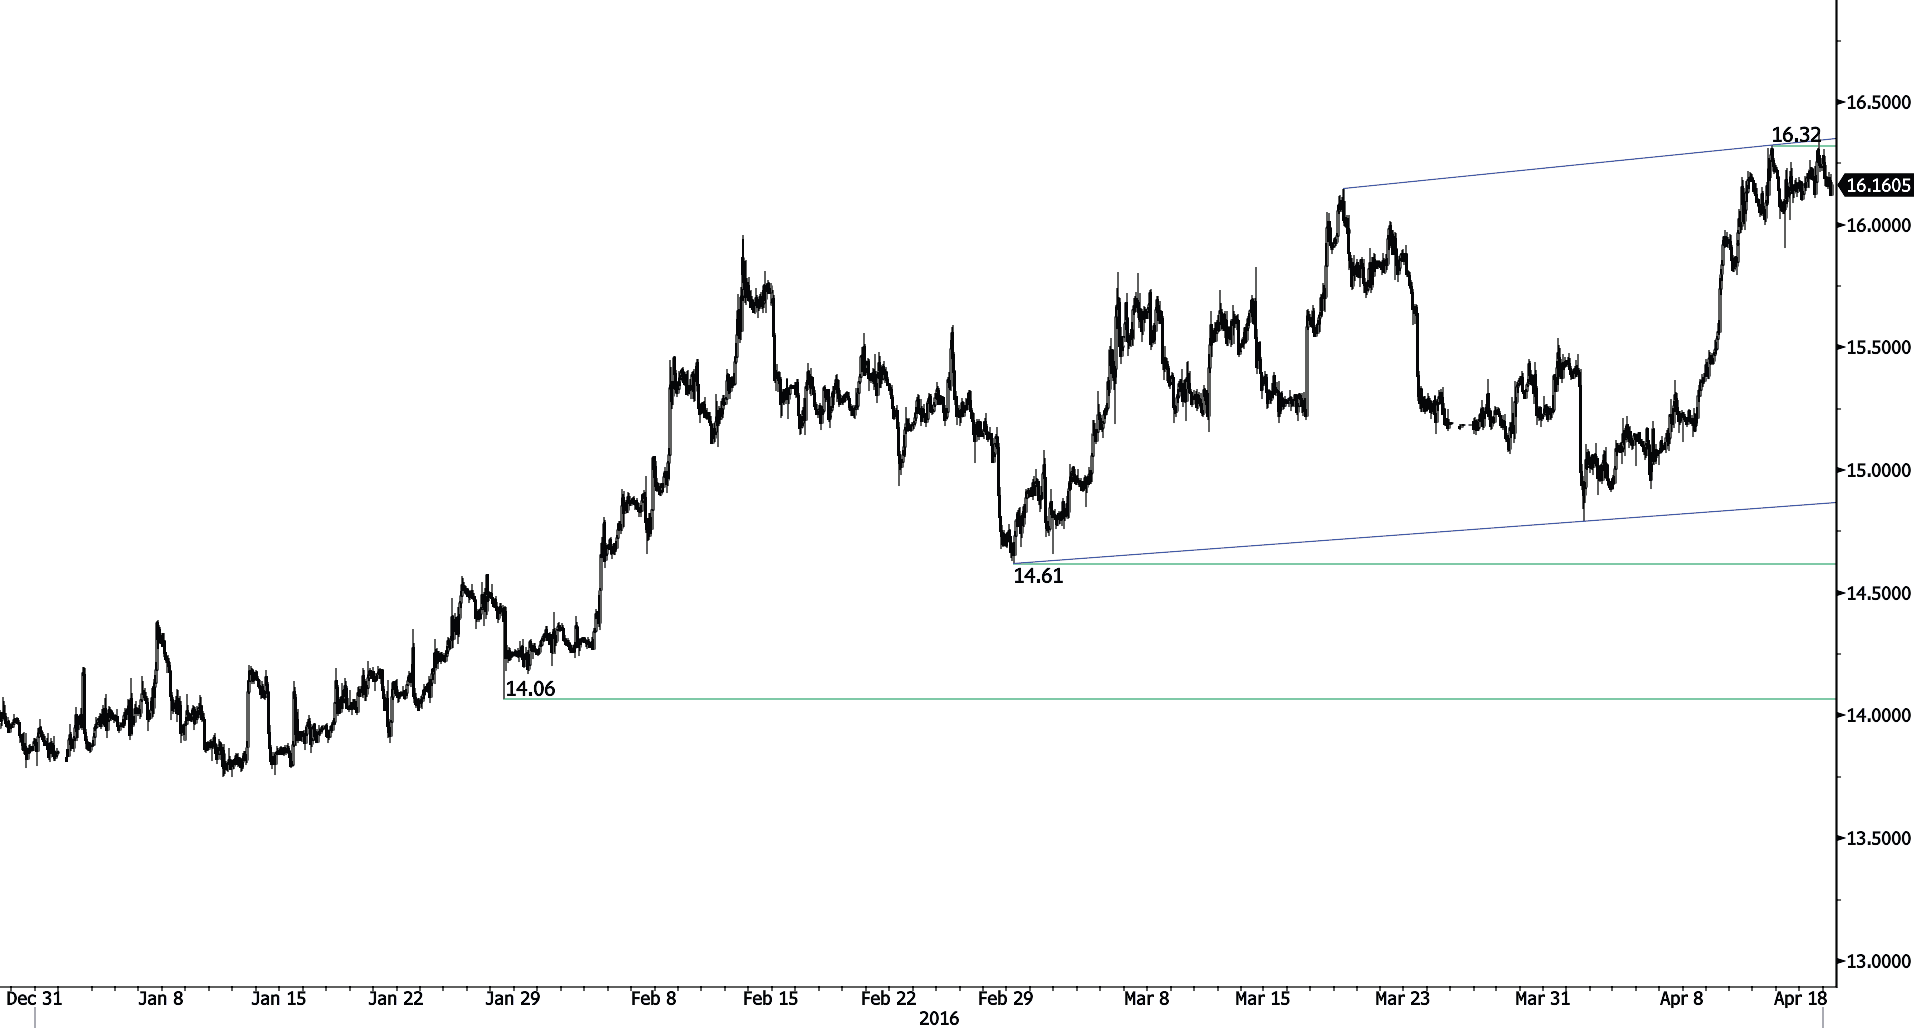
Silver is pushing again above 16.00 but is failing to go any higher. Resistance is given at 16.34 (28/10/2015 high) while support can be found at 14.79 (01/04/2016 low). Expected to see further bullish momentum as selling pressures do not seem sufficient to drive the metal lower.
-
In the long-term, the break of the major support area between 18.64 (30/05/2014 low) and 18.22 (28/06/2013 low) confirms an underlying downtrend. Strong support can be found at 11.75 (20/04/2009). A key resistance stands at 18.89 (16/09/2014 high).
Crude Oil (in USD)
Sharp decline.
-
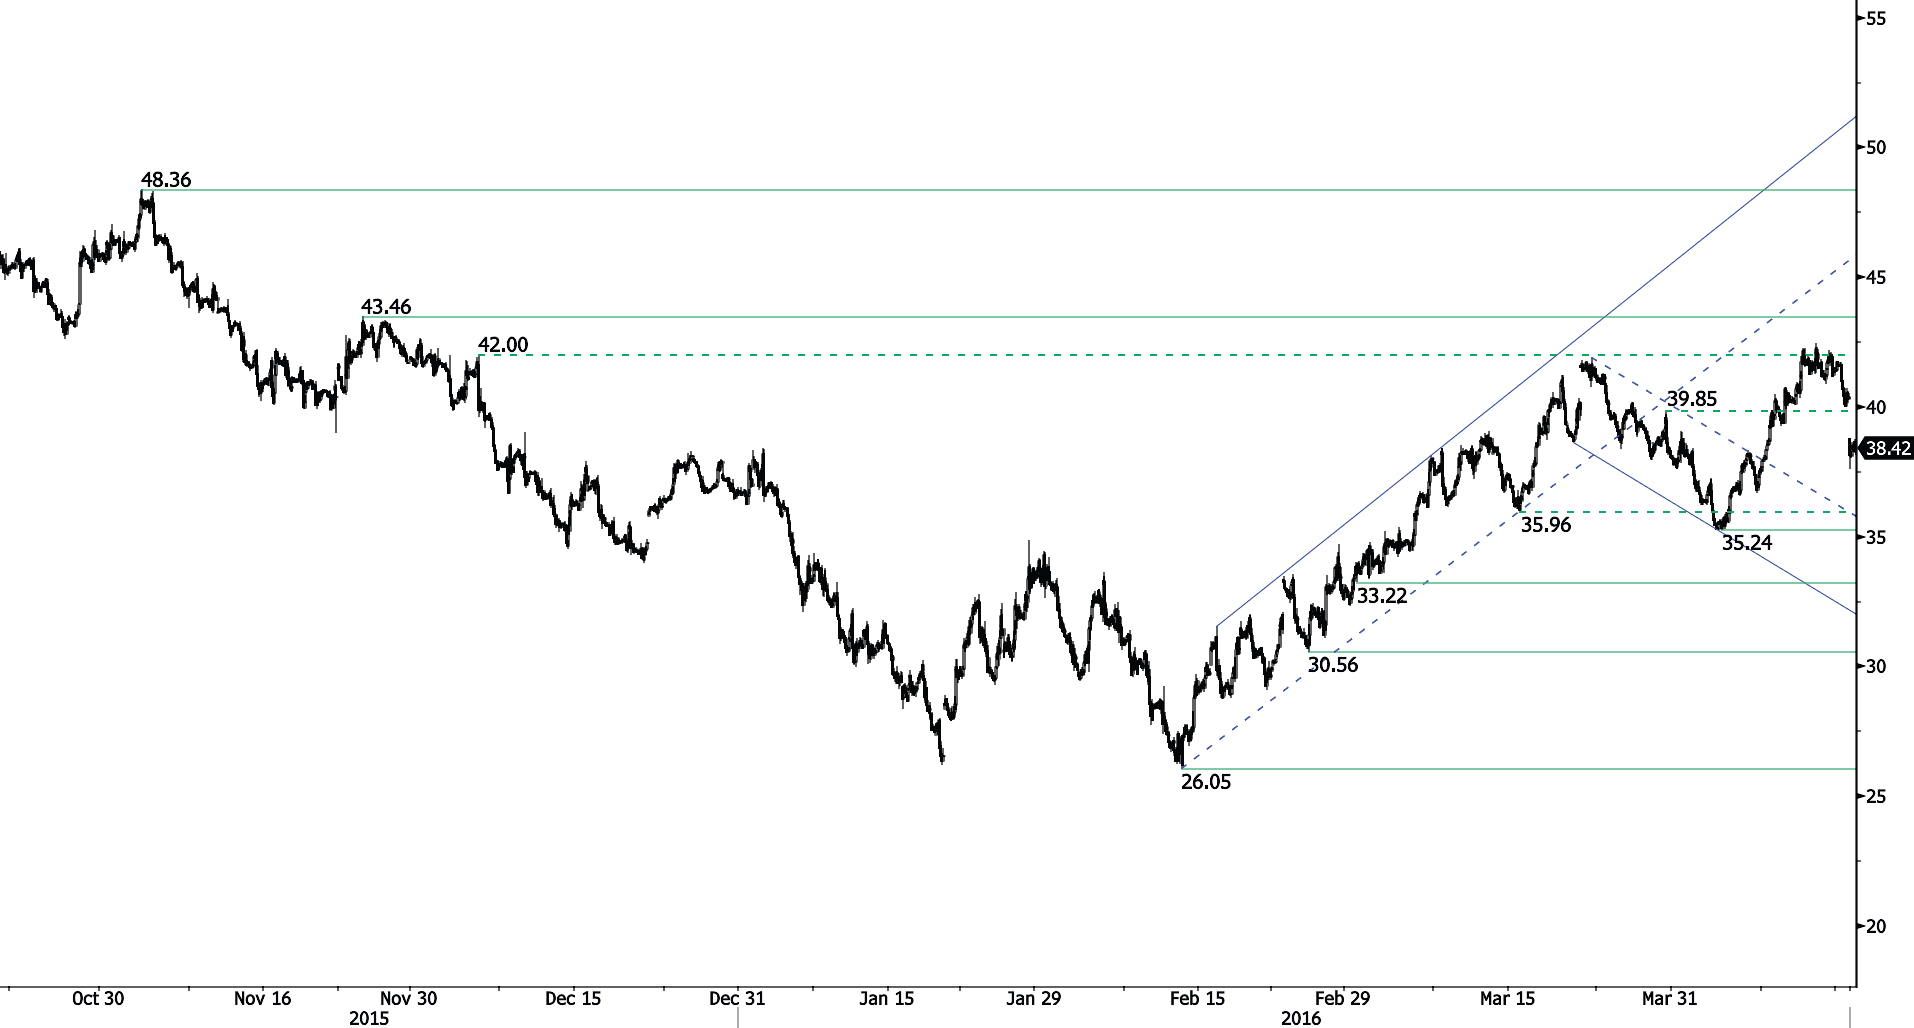
Crude oil is now well back below 40.00. Hourly support can be found at 35.24 (05/04/2016 low). Downside pressures are back on and pressures seem to grow. Expected to show further decline.
-
In the long-term, crude oil is on a sharp decline and is of course no showing any signs of recovery. Strong support at 24.82 (13/11/2002) is now on target. Crude oil is holding way below its 200-Day Moving Average (setting up at around 47). There are currently no signs that a reverse trend may happen.

This report has been prepared by Swissquote Bank Ltd and is solely been published for informational purposes and is not to be construed as a solicitation or an offer to buy or sell any currency or any other financial instrument. Views expressed in this report may be subject to change without prior notice and may differ or be contrary to opinions expressed by Swissquote Bank Ltd personnel at any given time. Swissquote Bank Ltd is under no obligation to update or keep current the information herein, the report should not be regarded by recipients as a substitute for the exercise of their own judgment.
Recommended Content
Editors’ Picks
EUR/USD clings to gains above 1.0750 after US data

EUR/USD manages to hold in positive territory above 1.0750 despite retreating from the fresh multi-week high it set above 1.0800 earlier in the day. The US Dollar struggles to find demand following the weaker-than-expected NFP data.
GBP/USD declines below 1.2550 following NFP-inspired upsurge

GBP/USD struggles to preserve its bullish momentum and trades below 1.2550 in the American session. Earlier in the day, the disappointing April jobs report from the US triggered a USD selloff and allowed the pair to reach multi-week highs above 1.2600.
Gold struggles to hold above $2,300 despite falling US yields

Gold stays on the back foot below $2,300 in the American session on Friday. The benchmark 10-year US Treasury bond yield stays in negative territory below 4.6% after weak US data but the improving risk mood doesn't allow XAU/USD to gain traction.
Bitcoin Weekly Forecast: Should you buy BTC here? Premium

Bitcoin (BTC) price shows signs of a potential reversal but lacks confirmation, which has divided the investor community into two – those who are buying the dips and those who are expecting a further correction.
Week ahead – BoE and RBA decisions headline a calm week

Bank of England meets on Thursday, unlikely to signal rate cuts. Reserve Bank of Australia could maintain a higher-for-longer stance. Elsewhere, Bank of Japan releases summary of opinions.