USD/CAD Price Forecast 2022: One reason the loonie will outperform other currencies against the US dollar
- Economic growth, central bank policy and WTI are the keys for USD/CAD.
- US and Canadian economies should recover together in 2022.
- Bank of Canada and the Fed reflect the same inflation concerns and outlook.
- West Texas Intermediate is the outlier for the Canadian economy.
The USD/CAD spent the first half of 2021 looking back to the worst days of the pandemic and the second half looking forward to an economic recovery that never quite arrived.
From January to June the steady decline of the USD/CAD continued the reversal that began after the COVID panic in March and April of 2020 and was a piece with the general shrinkage of the US dollar. The trend persevered long after the pandemic premium was eliminated in the summer of 2020 when the USD/CAD crossed 1.3300, its take-off point that March.
A fitful economic recovery in the US combined with waning COVID fears and the Federal Reserve’s unbending low interest rate policy, even after the Treasury market held a rousing yield rally in the first quarter, kept the greenback on the defensive until June of this year. The sharp drops through successive support lines at 1.2500, 1.2400, 1.2300 and finally 1.2200, and the equally rapid recovery that marked trading in May and June were the termination of the initial pandemic influence.

Neither the American or Canadian economy nor the policies of the Federal Reserve or the Bank of Canada (BOC) had predominance during the long USD/CAD decline and the clearest discrete influence was the price of oil.
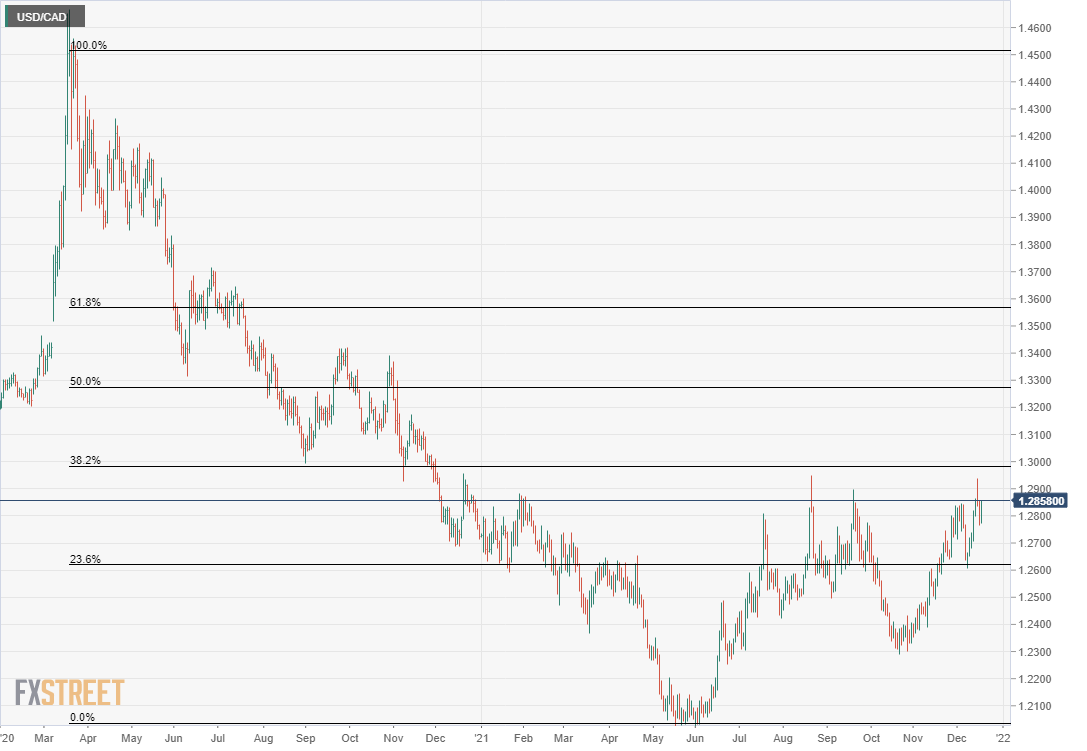
The second half recovery in the USD/CAD did not build to a trend as the reversal of the March 2020 to June 2021 decline cleared only the first Fibonacci retracement line at 1.2620 (23.6%), and then reversed half-way to the second at 1.2982 (38.2%), and repeated that cycle four times.
Trading motivation in the second half of the year gradually returned to American and Canadian economic, inflation and interest rate factors, though no clear trend was established.
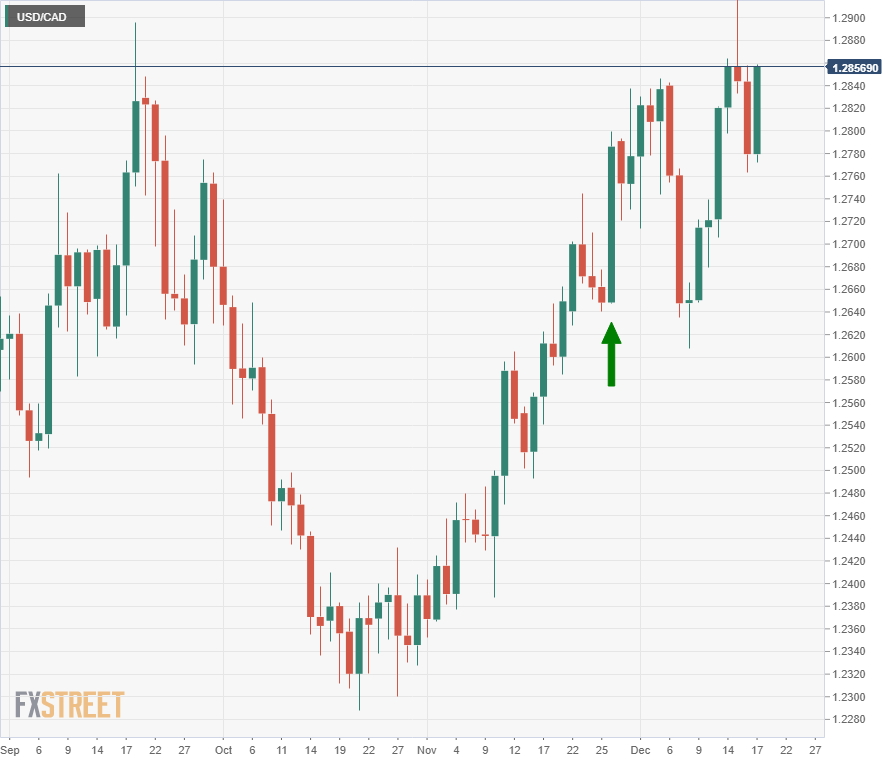
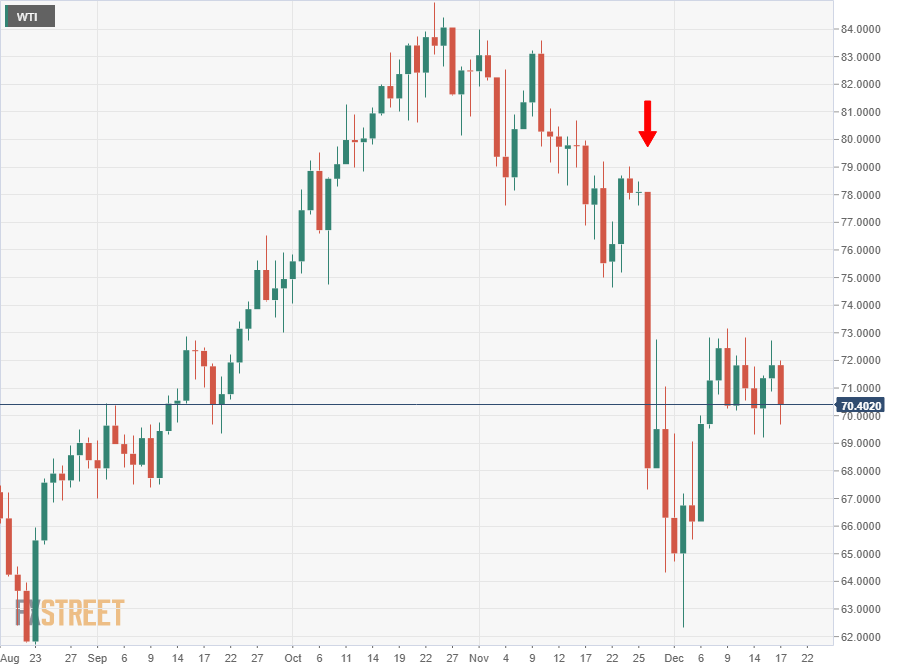
Periodic Covid scares roiled global markets. The most notable was on November 26 when the Omicron variant surfaced in the news.The Dollar/Canada rose more than a figure,1.1% from 1.2648 to 1.2786 on the rush to US dollar risk avoidance.
West Texas Intermediate (WTI) dropped an astonishing 12.8% from the open at $78.10 to $68.09.
The last quarter of trading for 2021 had currency markets looking to the Federal Reserve to power-up its inflation response.
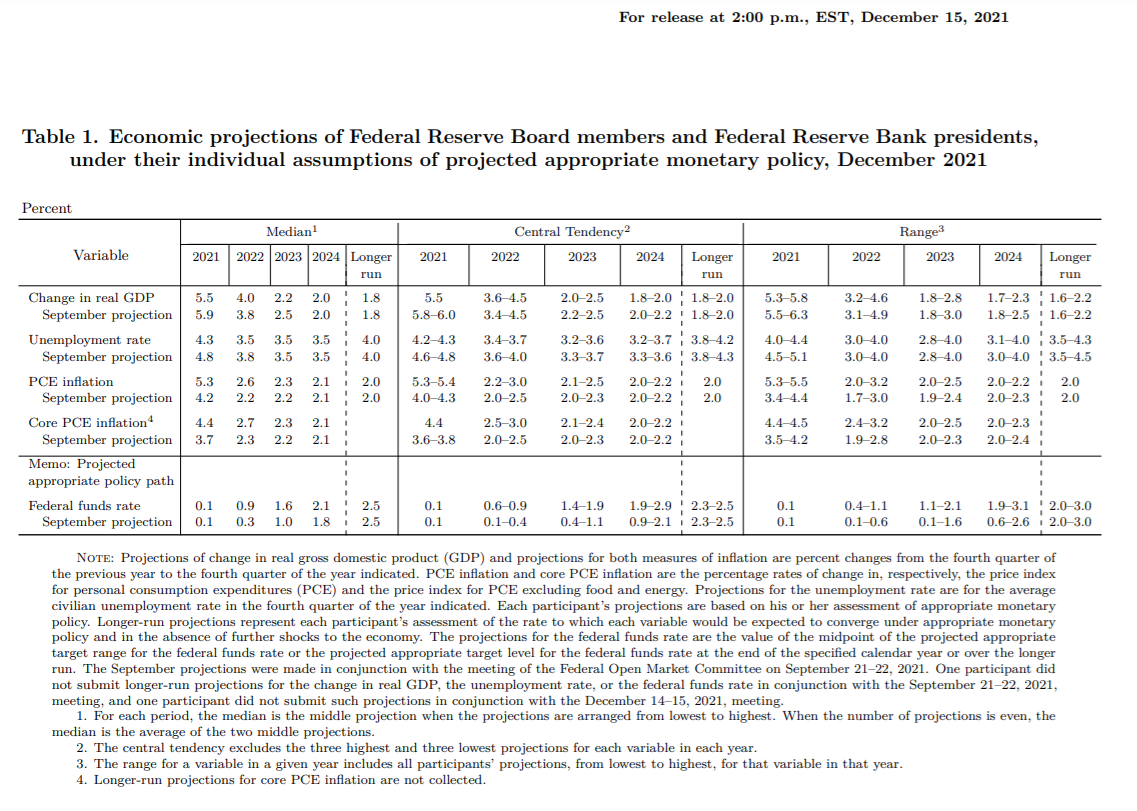
In the final Federal Open Market Committee (FOMC) meeting of the year on December 15, the bank doubled its monthly taper amount to $30 billion, ending the bond purchase program in mid-March 2022. The fed funds forecast in the Projection Materials was 0.9% for the end of 2022, implying three 0.25% hikes.These policy changes are not a substantial threat to the Canadian dollar because it is assumed that the Bank of Canada (BOC) will follow a similar path next year. Interest rate policy will not determine the USD/CAD trends in 2022.
Let’s look at the economic data for this year.
2021 Economy: Canada and United States
The course of true recovery was never smooth. Canada’s stricter Covid restrictions cost its economy some amount of growth but its less bountiful unemployment compensation helped the workforce to complete its recovery.
The US’s more varied COVID regime and expansive jobless benefits coupled with its massive pandemic relief bills pumped far more money into the economy, and the results are obvious in the Retail Sales, Gross Domestic Product (GDP) numbers and inflation.
Employment, Retail Sales and GDP
Canada was much more successful at restoring its labor economy than the US. Job losses from the lockdowns of March and April 2020 were fully recovered by October and the November unemployment rate of 6% was nearly back to its pre-pandemic 5.7% level of February 2020.
In the US, the employers represented in Nonfarm Payrolls had replaced 82.4% of the 22.4 million layoffs through November. The 4.2% US unemployment rate in November was about twice as far from its February 2020 level of 3.5%, as the Canadian rate, 0.7% vs 0.3%.
Retail Sales in the United States reflected the greater amount of cash distributed throughout the year. From January through October, Retail Sales expanded at an average rate of 1.64%. The distribution of pandemic rescue legislation cash in the months of January and March, produced increases of 7.6% and 10.7% respectively.
Canada’s average for the nine months from January to September was -0.54%. The widespread provincial restrictions imposed in the second quarter had a direct impact on Retail Sales which dropped 5.6% in April and 2.1% in May.
A direct translation to GDP was natural. In the US, annualized GDP was 6.4% in the first quarter, 6.7% in the second and 2.1% in the third for a 5.1% average.
For Canada the quarter-to-quarter annualized data was 5.5% in the first quarter, -3.2% in the second and 5.4% in the third quarter for an average of 2.6%, about half of the US.
Inflation
Inflation favored the US economy, if not the consumer. Shortages of goods and labor, encountered rising consumer demand and massive government spending, producing the highest annual inflation rate in 39 years.
The Consumer Price Index (CPI) rose nearly five-fold from 1.4% in January to 6.8% by November.
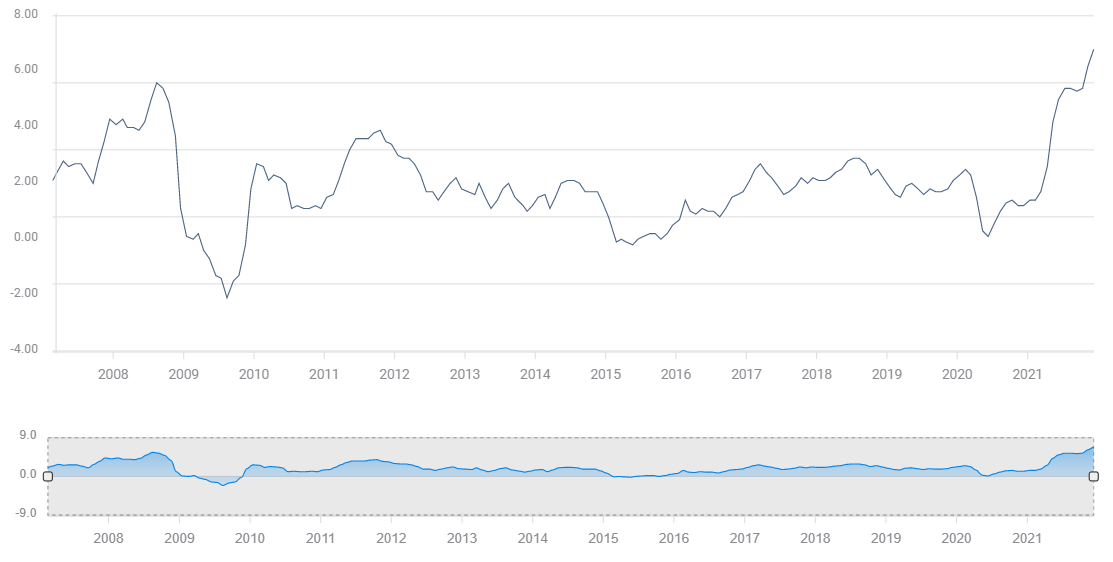
FXStreet
US Consumer Inflation in 2022: The uninvited guest takes up residence
For Canada the multiplication was similar, from 1% in January to 4.7% in September but with a 2.1% lower rate.
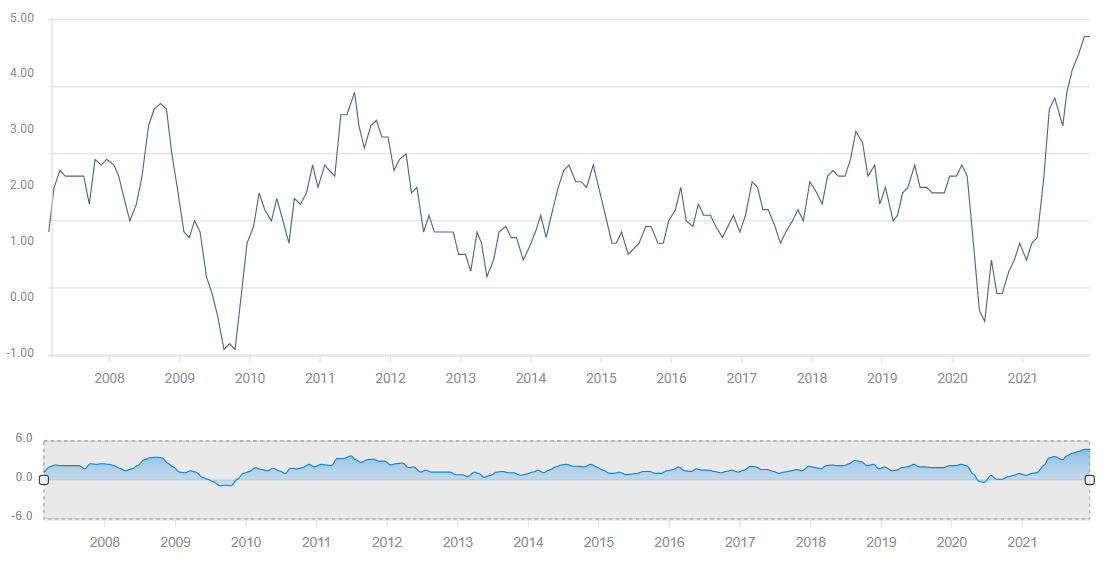
FXStreet
Producer prices on either side of the border indicated that inflation has not run its course.
The US Producer Price Index (PPI) climbed from 1.7% in January to 9.6% in November, the fastest gain in the 11-year record of the series..
Canada’s PPI jumped from 4.3% in January to 16.7% in October.
The cost increases stored in these indexes will almost certainly be passed through to the consumer, given the economy-wide price pressures. It is also possible that firms may take the general inflationary atmosphere as an opportunity to impose past cost increases that were not passed on to retailers and consumers at the time.
WTI
The inflation excess of WTI, the pricing standard for the Canadian and American oil industries, and global crude oil in general, warrants a separate entry.
Oil is the basic industrial commodity. In one form or another, as energy or feedstock, oil is part of nearly every product and economic transaction in the modern world.
Crude oil’s rise began at $35.90 on November 3, 2020. To its peak on October 26 this year at $84.05, the price of a barrel had climbed 134%.
Oil’s increase so far this calendar year is 45%, from $48.49 on January 1 to $70.52 on December 17.
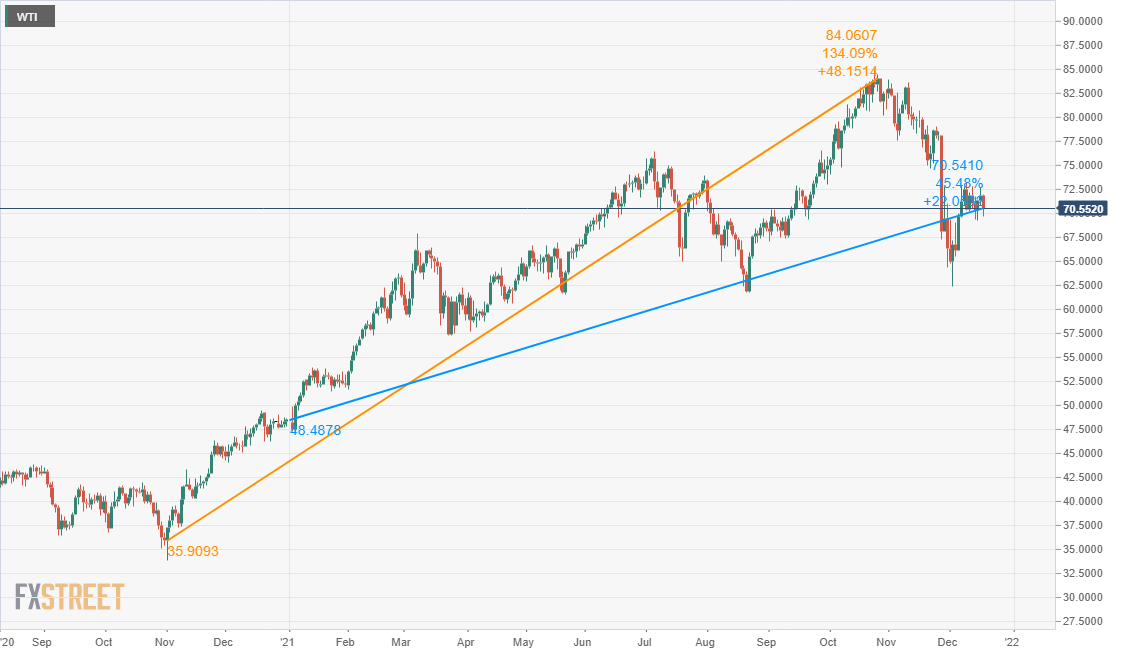
Pump prices have tracked crude oil. A gallon of regular gasoline cost $2.25 at the nationwide average on January 1, and on December 13 it was $3.32, a 47.5% increase.
Two factors pushed oil prices higher.
The election of Joseph Biden to the US presidency in November 2020 brought a different set of energy policies. The market correctly anticipated the supply restrictions that Mr. Biden enacted after assuming the White House.
Second, the global economic recovery was expected to stimulate demand. The sensitivity of crude prices to economic growth was amply demonstrated on November 26 when the global market panic over the Omicron variant crushed WTI 12.8% in one day.
Wages and inflation
Inflation acts as a tax on consumer spending. It inexorably reduces purchasing power and in response, workers look to wage increases for compensation.
Wages in the US were already rising as employers began offering pay increases to overcome the labor shortage.
Consumer prices in the last 12 month have increased at the fastest pace in 71 years and short-term inflation expectations have jumped with them.
A survey from the New York Federal Reserve showed that in November consumers expected inflation to be 6% over the next year, up from 5.7% in October. Anticipated wage gains for the same period dropped to 2.8% from 3% in October. November’s figures leave a 3.2% wage gap, the widest since the survey began in 2013.
The conditions for a wage-price spiral have already begun in the US as workers add inflation to pay demands.
Annual Average Hourly Earnings (AHE) in the US have not outpaced inflation since March. In September, October and November, wage gains averaged 4.7% but the CPI was 6.1%. Each month, US consumers lost 1.4% in purchasing power.
For Canadian workers the losses are similar. Average Hourly Wage gains have not been higher than CPI since February. The September to November averages are 4.7% for CPI and 2.3% wages, for a loss of 2.4% monthly.
Central Bank Policy: Bank of Canada and the Federal Reserve
Governor Tiff Macklem and the Bank of Canada have been at the forefront of the policy reversal that will define both banks’ efforts in 2022. The BOC’s far smaller quantitative easing program (QE), C$16 billion a month of bond purchases, was ended at the October 27 meeting. It was no coincidence that October was the month that the Net Change in Employment report completed the recovery of Canada’s lockdown job losses.
The Fed’s first restriction of its $120 billion a month QE program came at the November 3 FOMC with a $15 billion cut. Surging inflation, (as above), in the six weeks to the next FOMC meeting on December 15 convinced the voting members to double the taper to $30 billion, ending the entire program by the middle of March 2021. More importantly, the Projection Materials that chart the estimates of the FOMC members and Fed staff, showed a majority of contributors expected three rate increases in 2022. The Fed will not increase the fed funds rate until the QE purchases are completely phased out. Chair Jerome Powell repeated that stricture at his December 15 press conference.
The BOC has said they will not hike rates until the second quarter at the earliest. That puts Canada's first possibility on April 13 three weeks ahead of the Fed's first post-March meeting on May 3-4.
Fed Governor Christopher Waller put the March 15-16 FOMC meeting in play when he said to the New York Forecasting Club on December 17, “The whole point of accelerating the tapering was to end it much faster in March so the March meeting could be a live meeting. That was the intent”.
Markets are divided on Mr. Waller's assertion. The Fed Funds Futures from the Chicago Board Options Exchange (CBOE) shows a nearly even split, with 49.5% excpecting no change in the fed funds and 50.5% anticipating an increase at the March meeting.
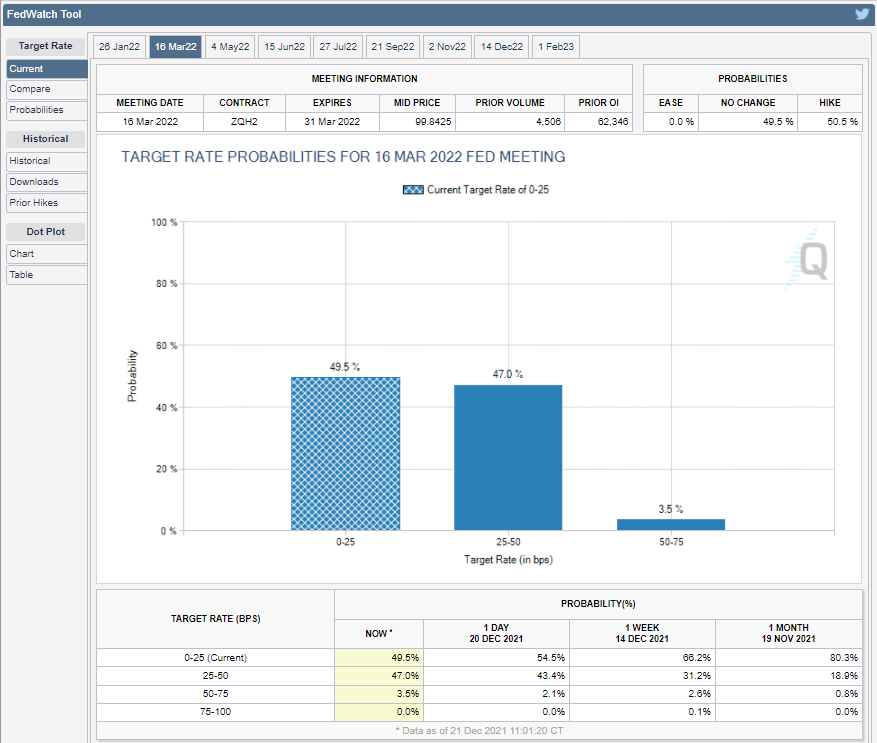
CBOE
Interest Rates: Canada and the US
Canadian and US sovereign rates are among the highest in the developed world. In 10-year bonds, only Australia and New Zealand have higher returns.

Financial Times
This advantage has helped to keep yields from rising even as the two central banks have embarked on new tightening policies. Bond prices trade inversely to yields and market demand for return has kept bond prices high and rates low.
The spread between the 10-year Canadian and US bonds has varied considerably this year.
At the start of the year on January 4 the US advantage was 24 basis points. That edge was maintained, with varying distance down to about 7 points until the first week in October when the Canadian debt obtained a small advantage. On October 26 the spread favored Canada by 1 basis point.
On October 27, the BOC unexpectedly ended its bond purchases and the spread widened to 9 basis points on the close, 1.619% for Canada and 1.529% for the US. By October 29 the distance between the two yields was 17 basis points. The Canadian advantage began to ebb in the closing week of November.
On December 8, the Canadian 10-year was still favored by an 8 point advantage. The next day the edge had dropped to 3 points, 1.517% to 1.487% and on December 10 the lead had reverted to the US note, by 2 points.
At the close of trading on December 16 the US 10-year Treasury yield was up 9 points, 1.424% to 1.334%.
The declining US rate advantage generally matched and probably assisted the falling fortunes of the USD/CAD for the first half of the year. The return of a rate advantage in late October to the Canadian debt from the conclusion of its bond program did not provoke a drop in the USD/CAD as markets were looking forward to the Fed taper announcement, which was received at the November 3 FOMC.
Conclusion: 2021
The long decline in the USD/CAD from its pandemic panic peak of just over 1.4500 in March 2020 to 1.2035 in early June this year lasted 15 months. For most of that time global markets were operating in the pandemic zone. This kept the withdrawal of the US dollar’s risk premium active long past the time where there was any advantage to extract. As with many trends, it continued until there was replacement logic.
The COVID vaccines became available in January but it took the declining case numbers in the spring and summer to convince markets a recovery was at hand.
The apparent retreat of the pandemic was joined by excellent US job growth in June, July and August. The expected recovery in the US economy and Treasury rates drove the four-month surge in USD/CAD from June to September.
That expectation also pushed WTI to its seven-year high of $85.64 on October 26.
When WTI cleared the previous top and resistance at $76 in late September, the following sharp ascent in October provoked a reversal in the USD/CAD which dropped from over 1.2700 to 1.2300 in three weeks.
This brings us to WTI’s central role in the Canadian economy and its potential differential for the Canadian dollar next year.
Canada and US in 2022
The Canadian and US economies are easily the most closely linked major economies in the industrial world. The well-known longest undefended border on the planet, is barely a dividing line at all when it comes to economic transactions and activity.
Another way to put it is, though there are differences from politics, policy and habits, the two economies tend to operate as a unit. Not, perhaps in any strict economic-zone sense, but in that they are so alike and complementary, they respond to global economic conditions in nearly identical fashion.
If the US economy recovers and prospers, so will Canada’s. Growth rates on either side of the border will be part of the same recovery and will not differ enough to have a market impact.
One difference for the coming year will probably be a higher inflation rate in the US.
Washington has poured far more liquidity into its economy. The result is a soaring American Consumer Price Index.
Canada’s November CPI was 2.1% lower than that of the US in November, 4.7% vs 6.8%, though the acceleration from January was about the same.
Part of the reason the US tends to enact much larger fiscal packages and debt is due to its scheduled elections. With a vote for the entire House of Representatives never more than two years away, whatever party is in power spends the public purse on the well-tested notion that the voters like largesse from DC. Congress has spent more than $6 trillion dollars in excess of normal budgetary needs in the last two years.
The enormous fiscal outpouring from Washington and the Fed’s rate manipulation have created the perfect monetary conditions for inflation. The only surprise has been the inability or refusal of all involved to see the inflationary potential created by these policies.
BOC and the Fed in 2022
The Federal Reserve has a dual mandate, price stability and maximum employment. The employment responsibility has tied its policies to promoting economic growth to a greater degree than most other central banks. Fed governors have a long history of expanding the money supply in support of economic activity and employment.
The Bank of Canada’s sole responsibility is inflation.
When COVID struck last March, the Fed cut the fed funds rate to 0.25% and initiated $120 billion a month in credit market purchases designed to push commercial rates to near zero and keep them there as long as needed. Since then, the yield on the 10-year Treasury has been kept to its lowest range in modern history.

CNBC
The BOC and the Fed will be pursuing the same inflation policy in 2022. Tiff Macklem, the BOC governor, may or may not raise raise the overnight rate before Jerome Powell and the FOMC, but US inflation will give the fed funds a higher endpoint. Inflation may also prompt the Fed to act faster once it starts, because the higher US price increases are coupled with a distorted labor market that is already driving the wage side of a price spiral.
WTI in 2022
The sensitivity of the Canadian economy and the loonie to oil prices was amply demonstrated in the November 26 WTI collapse.
As the pandemic fades into endemic normality, by the end of the winter the demand for oil will rise. A strong global economic recovery could push WTI above its recent high and back to the range above $80 where it traded from October 2010 to October 2014.

The US has crippled its own oil industry, not in production so much as in outlook and investment. Until last year, the US was the world’s largest oil driller and its main swing producer. North American fracking operations could be counted on to increase production in step with demand. That ability is now diminished and the current swing producers, Russia and OPEC have no incentive to raise output, they prefer higher prices.
Conclusion: USD/CAD in 2022
Of the three main fundamental factors for the USD/CAD in 2022, the comparative Canadian and US economies, central bank interest rates and the price of oil, the first is a wash, the second tilts to the US and the third is unlikely to rise sufficiently to give the loonie a long-term advantage.
The US and Canadian economies are likely to grow at similar rates next year. Except for oil’s far greater importance north of the border, the two economies are complementary.
Interest rates may rise first in Ottawa, which could give the Canadian dollar an edge in the start of the second quarter, mostly on the assumption that an April rate hike would be a surprise. If the Fed hikes in March it should convince the credit markets of the governors' seriousness and set the stage for rally in US Treasury yields and the USD/CAD.
Central bank rate speculation depends on the course of inflation. If the American inflation reports leading to the March FOMC meeting show high or accelerating price increases, a March fed funds hike will rise to a near certainty.
American inflation rates are not only higher than those in Canada, but the backlog of monetary accommodation and the current flood of fiscal stimulus in the States, will continue to pump money into the economy. If the Biden administration manages to pass its development bill, priced somewhere between $2 and $5 trillion, next year, it will exacerbate monetary conditions even further, guaranteeing a prolonged Fed response.
While the global economy seems sure to accelerate in the spring, lingering pandemic conditions, and perhaps deeper changes to labor and production practices, could limit growth. It has been more than seven years since WTI traded above $80 for an extended period. In that time, fracking has come to dominate crude production in the US and Canada.
The Biden administration has hindered US production but a sustained rise in WTI will still be met by increased production from all of North America. Oil’s price potential is considerably less than it was from 2010 to 2014 in the recovery after the financial crisis. Oil pricing alone, in the range it is likely to have in 2022, will not be enough to give the loonie a long-term advantage over the USD dollar.
The USD/CAD, like the US dollar overall, will benefit from the Fed’s 2022 inflation fight.
With the European Central Bank indicating that a rate hike is unlikely in 2022 and Japan trapped in the BOJ’s endless bond buying and Tokyo’s fruitless stimulus, the resource economies and the US will perform the best next year.

The USD/CAD should have a good year with a target range of 1.3000 to 1.3500.
Dollar-Canada will come in second to the greenback in 2022, but it should be ahead of everything else.
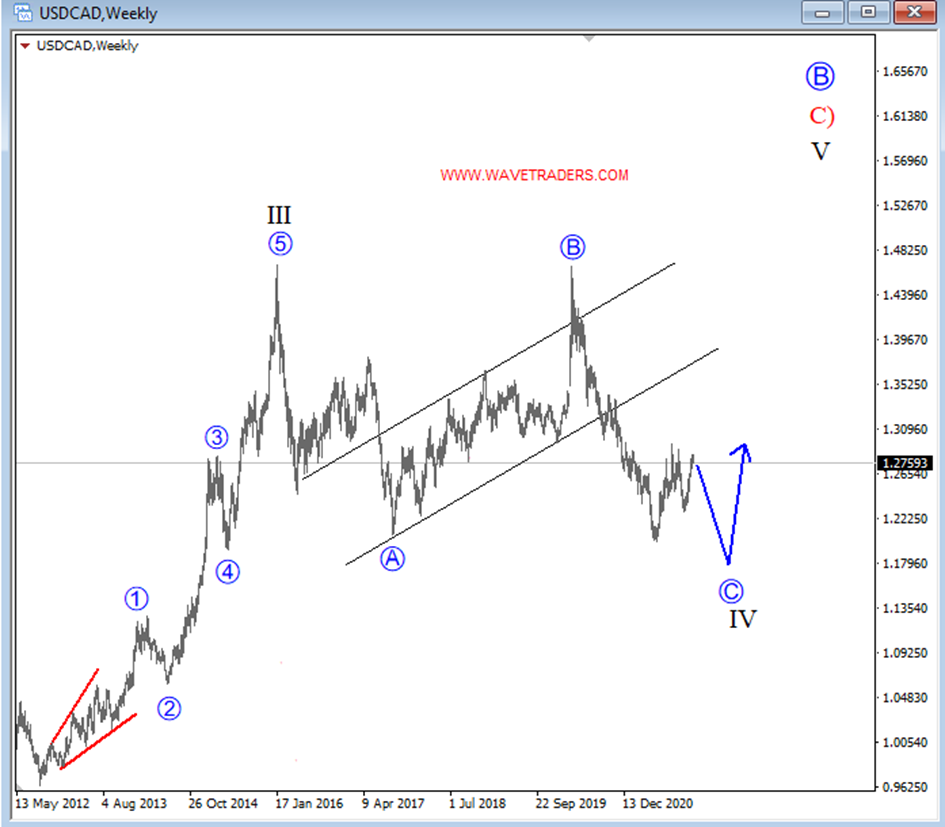
Gregor Horvat projects a possible bullish correction for the Canadian dollar/US dollar pair on his Elliott Wave analysis:
USD/CAD Elliott Wave Analysis

USDCAD is coming down as expected, but notice that it’s wave C as part of a big flat correction, so downtrend may not last long, but pair may retest the 1.2 psychological level before bulls shows up. Crude oil will be also very important guide for USDCAD pair; more gains on crude will likely limit any upside on USDCAD pair.
Forecast Poll 2022
| Forecast | Q1 - Mar 31st | Q2 - Jun 30th | Q4 - Dec 31st |
|---|---|---|---|
| Bullish | 29.10% | 19.23% | 11.11% |
| Bearish | 45.83 | 23.07% | 51.85% |
| Sideways | 25.00% | 57.69% | 51.85% |
| Average Forecast Price | 1.2440 | 1.2465 | 1.2393 |
| EXPERTS | Q1 - Mar 31st | Q2 - Jun 30th | Q4 - Dec 31st |
|---|---|---|---|
| Alberto Muñoz | 1.3000 Bullish | 1.3350 Bullish | 1.3675 Bullish |
| Andrew Lockwood | 1.3000 Bullish | 1.2840 Sideways | 1.2595 Sideways |
| Barclays | 1.2300 Bearish | 1.2200 Bearish | 1.2100 Bearish |
| BMO Capital Markets Team | 1.2500 Bearish | 1.2500 Sideways | 1.2300 Bearish |
| BoA FX Rates & Commodities Team | 1.2400 Bearish | 1.2100 Bearish | 1.2000 Bearish |
| Brad Alexander | 1.2500 Bearish | 1.2700 Sideways | 1.3000 Sideways |
| Brian Wang | 1.3755 Bullish | 1.2840 Sideways | 1.2595 Sideways |
| CIBC World Markets Team | 1.2700 Sideways | 1.2900 Sideways | 1.3000 Sideways |
| CitiFX | 1.2700 Sideways | 1.2800 Sideways | 1.2600 Sideways |
| Commerzbank Analyst Team | 1.2800 Sideways | 1.2900 Sideways | |
| Gil Ben Hur | 1.3044 Bullish | 1.3360 Bullish | 1.3643 Bullish |
| Goldman Sachs | 1.2200 Bearish | 1.2000 Bearish | 1.1800 Bearish |
| ING Global Economics Team | 1.2300 Bearish | 1.2200 Bearish | 1.2200 Bearish |
| JP Morgan | 1.2400 Sideways | 1.2300 Sideways | |
| Frank Walbaum | 1.3100 Bullish | 1.3250 Bullish | 1.2100 Bearish |
| Matias Salord | 1.2650 Sideways | 1.3130 Bullish | 1.3210 Bullish |
| Murali Sarma | 1.3000 Sideways | ||
| NAB Global Markets Research | 1.2500 Bearish | 1.2500 |