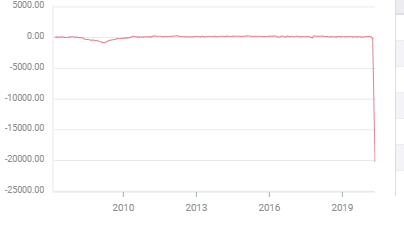
- Payrolls forecast to lose 22 million jobs in April
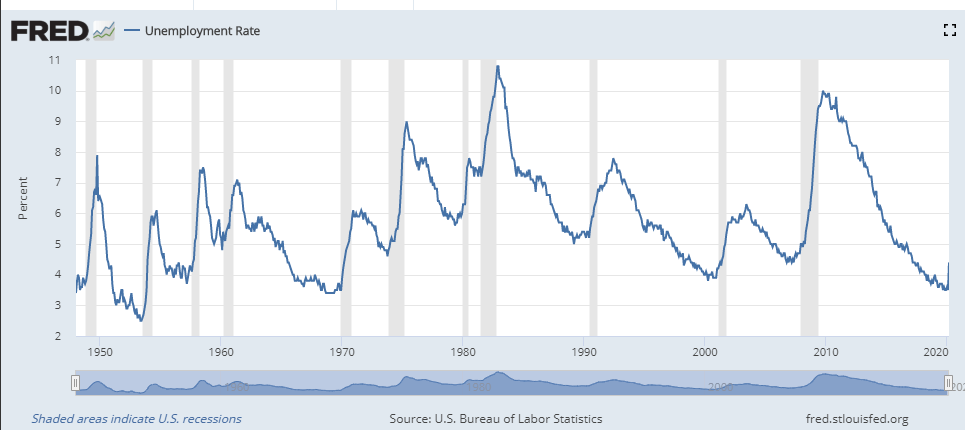
- Unemployment rate to jump to 14%, highest since the 1938 recession
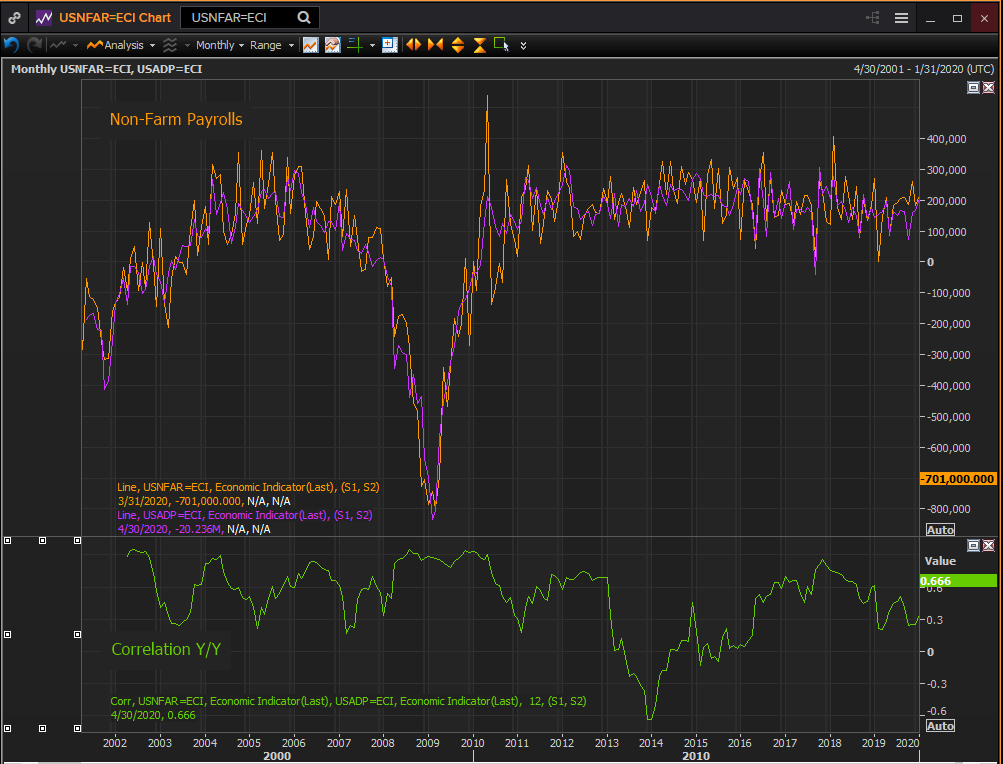
- Extent of the labor collapse well established by initial claims and ADP
- Market impact likely to be minimal unless estimates are wrong
The collapse of the American labor market is a no longer a surprise. After seven weeks of initial claims numbers beyond anything previously experienced and a private payrolls figure that eliminated a decade’s job growth in one month markets are exhausted by superlatives.
Non-farm payrolls in April will set a record for the greatest destruction of work in US history, the unemployment rate will vault to an 82 year high with the fastest increase on record and markets will likely have a pleasant, if slightly nervous Friday if there is nothing else exciting on the agenda.

It’s not that the economic, political and moral dimensions of the pandemic are uninvolving but that markets have already done their work. The economic debacle in its current shape has been priced into equity, credit and currency levels. Non-farm payrolls, unless it is substantially different than its forecast will add nothing to our knowledge.
Wednesday’s response to the ADP April data and Thursday’s trading in equities (Dow +211.25) showed few concerns about NFP. The bond market, with the 10-year Treasury off 7 basis points in yield to 0.64% and the dollar up about 40 points versus the euro and down about 20 against the yen, were slightly more wary the day before the payroll report.
ADP
 FXStreet
Employment indicators
Initial jobless claims have been the telltale for the labor market and the first guide for the overall economy. There are few weekly economic statistics and claims have been invaluable, as they were during the financial crisis, in alerting markets and policy makers to what was around the curve.
More than 33 million people in the United States have been laid off in the last seen weeks. The translation of this data into the ADP and NFP statistics is a matter of different categories and criteria rather than conclusion.
 Reuters
It is probable that the initial claims figures themselves, as they are subject to the least eligibility requirements, one needed only to have a job and lost it to collect, provide the most accurate picture of the catastrophe.
The unemployment rate, for instance has a one month search requirement. As many of the laid off workers hope to return to their jobs they may not have looked for a new post in the previous month. If they did not, they would not be counted as unemployed.
Each month the Bureau of Labor Statistics (BLS) estimates the number of newly created but unreported jobs and adds that figure into payrolls. What effect that might have on April’s payrolls figures is unknown. How would the BLS update a historically based job creation model to the current economic situation? Will they continue to use the standard calculation? Again, answer on Friday.
The purchasing managers’ indexes from the Institute for Supply Management (ISM) in manufacturing and services also fell deep into contraction in April.
Purchasing managers' indexes
The overall manufacturing PMI dropped to 41.5 in April the weakest score since April 2009. The new orders index sank to 27.1 and the employment index to 27.5, the worst reading in 11 and 71 years respectively.
The service sector dropped into contraction for the first time since the financial crisis.
The non-manufacturing purchasing managers’ (PMI) index fell to 41.8 in April from 52.5 in March. It was the first month without growth for the service sector’s two-thirds of US GDP since 49.7 in December 2009.
Services PMI
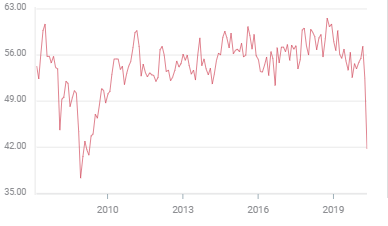
Business activity, new orders and employment contributed to the service collapse with readings of 26 and 32.9 and 30 respectively, all the lowest since the series began in July 1997.
 Reuters
Only two of the 18 different service industries tracked by ISM expanded in April, finance which has been administering Washington’s emergency business loan program and the government itself.
Consumption and GDP
Personal spending, which accounts for between 65% and 70% of US GDP, dropped 7.5% in March. This was more than three times the next largest monthly decline of 2.1% in January 1987 for data that stretches back to 1959. Personal income decreased 2% in March down from 0.6% in February.
Real personal spending, which is inflation-adjusted, fell 7.3%, the most in its 18 year history. The largest prior decreases were 0.9% in September 2009 and December 2018.
Retail sales sank 8.4% in March, more than twice the previous low of -3.8% of October 2008 and durable goods orders fell 14.8%, the second largest amount in its history. Both series began in 1992.
Industrial production plummeted 5.4% in March, a 75 year record for one of the longest running US government statistics which started in February 1919.
Gross domestic product contracted 4.8% in the first quarter despite the fact that the layoffs and social restrictions did not start until mid-March and the economy had been expanding at an estimated 2.7% in January and February.
The Atlanta Fed GDPNow estimate for second quarter GDP was -17.6% on May 5.
To put the economic situation in context, since the Second World War the three worst quarterly declines in annualized GDP were -9.98% in the first quarter of 1958, -8.38 in the fourth quarter of 2008 and -7.99% in the second quarter of 1980.
 The consumption reading from March are just a foretaste of the probable figures for April.
The declines in personal spending, real personal spending, retail sales and durable goods orders will likely be setting the same type of historical records that the labor market has initiated. If so second quarter GDP will also set a new record for largest loss in US history, including the Depression.
Conclusion: Markets and the dollar
The parameters of April’s non-farm payrolls report have been established by initial jobless claims and the ADP figures. Markets await the details. Will the unemployment rate be 14%, 12% or 17%? Is 22.2 million vacated jobs accurate or will it be 21 million or 25 million?
Payrolls are the market’s favorite US economic statistic. Even though the outlines of the report are well known and unlikely to provide any substantive surprises, will the confirmation of upwards of 20 million destroyed jobs shock traders? Will it send equities cascading and the dollar and bonds flying? It is doubtful, but markets, like individuals can be surprised by their own emotional reactions.
After all, the author admits to sobbing over Beaches on an airplane.
Information on these pages contains forward-looking statements that involve risks and uncertainties. Markets and instruments profiled on this page are for informational purposes only and should not in any way come across as a recommendation to buy or sell in these assets. You should do your own thorough research before making any investment decisions. FXStreet does not in any way guarantee that this information is free from mistakes, errors, or material misstatements. It also does not guarantee that this information is of a timely nature. Investing in Open Markets involves a great deal of risk, including the loss of all or a portion of your investment, as well as emotional distress. All risks, losses and costs associated with investing, including total loss of principal, are your responsibility. The views and opinions expressed in this article are those of the authors and do not necessarily reflect the official policy or position of FXStreet nor its advertisers. The author will not be held responsible for information that is found at the end of links posted on this page.
If not otherwise explicitly mentioned in the body of the article, at the time of writing, the author has no position in any stock mentioned in this article and no business relationship with any company mentioned. The author has not received compensation for writing this article, other than from FXStreet.
FXStreet and the author do not provide personalized recommendations. The author makes no representations as to the accuracy, completeness, or suitability of this information. FXStreet and the author will not be liable for any errors, omissions or any losses, injuries or damages arising from this information and its display or use. Errors and omissions excepted.
The author and FXStreet are not registered investment advisors and nothing in this article is intended to be investment advice.
Recommended Content
Editors’ Picks
EUR/USD holds below 1.0750 ahead of key US data

EUR/USD trades in a tight range below 1.0750 in the European session on Friday. The US Dollar struggles to gather strength ahead of key PCE Price Index data, the Fed's preferred gauge of inflation, and helps the pair hold its ground.
USD/JPY stays firm above 156.00 after BoJ Governor Ueda's comments

USD/JPY stays firm above 156.00 after surging above this level on the Bank of Japan's decision to leave the policy settings unchanged. BoJ Governor said weak Yen was not impacting prices but added that they will watch FX developments closely.
Gold price oscillates in a range as the focus remains glued to the US PCE Price Index

Gold price struggles to attract any meaningful buyers amid the emergence of fresh USD buying. Bets that the Fed will keep rates higher for longer amid sticky inflation help revive the USD demand.
Bitcoin Weekly Forecast: BTC’s next breakout could propel it to $80,000 Premium

Bitcoin’s recent price consolidation could be nearing its end as technical indicators and on-chain metrics suggest a potential upward breakout. However, this move would not be straightforward and could punish impatient investors.
US core PCE inflation set to signal firm price pressures as markets delay Federal Reserve rate cut bets

The core PCE Price Index, which excludes volatile food and energy prices, is seen as the more influential measure of inflation in terms of Fed positioning. The index is forecast to rise 0.3% on a monthly basis in March, matching February’s increase.