WTI Elliott Wave technical analysis [Video]
![WTI Elliott Wave technical analysis [Video]](https://editorial.fxstreet.com/images/Macroeconomics/EconomicIndicator/EconomicHealth/Manufacturing/olive-oil-gm178524958-22748657_XtraLarge.jpg)
WTI Elliott wave analysis
Function - Counter-trend.
Mode - Corrective.
Structure - Triple Zigzag.
Position - Wave X of triple zigzag.
Direction - Wave X of the triple zigzag is still in play.
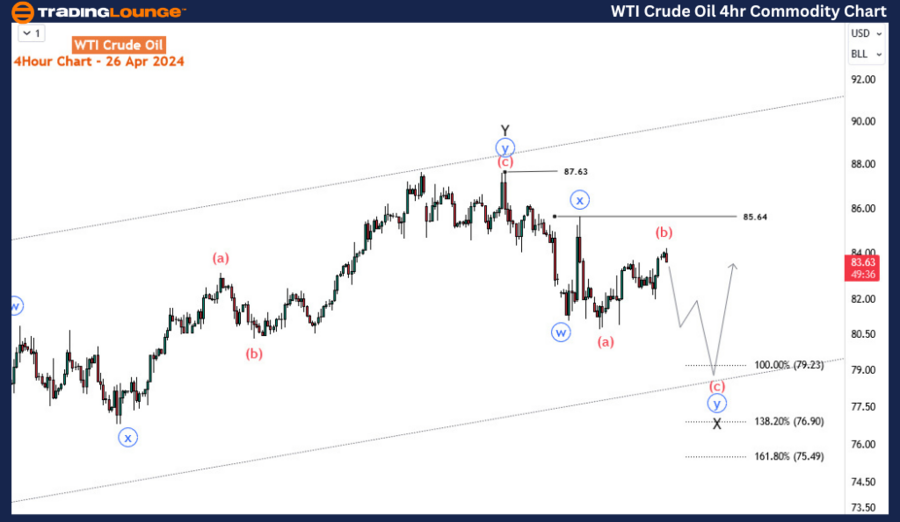
Details - We still count a double zigzag for wave X. Current rally should stay below 85.64 to confirm (b) before turning down for (c) around 79.23-76.90. Invalidation below 75.49 will make us consider an impulse from 87.63 instead. Overall, WTI still supports the medium-term bullish triple zigzag sequence provided 75.49 is not breached. Not changed from the last update.
WTI crude oil prices are currently undergoing a retracement of the pullback initiated on April 12th. This pullback, in conjunction with the ongoing recovery, appears to be corrective rather than indicative of a substantial reversal. Looking ahead, there's a likelihood of witnessing another upward movement surpassing the high set on April 12th in the upcoming weeks. However, it's crucial to note that the bullish corrective sequence, initiated in December 2023, remains intact, awaiting a definitive break, potentially signaled by an impulse wave downward.
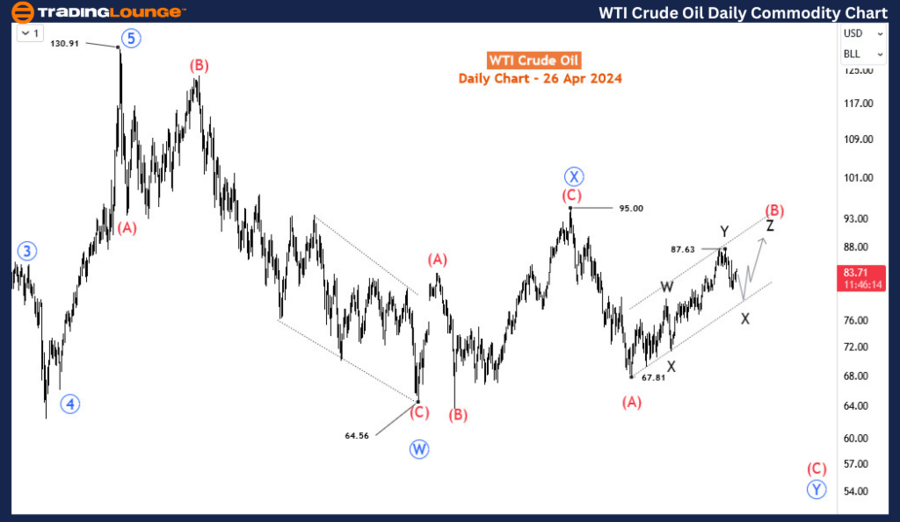
Analyzing the long-term perspective, particularly on the daily chart, reveals a corrective price structure evolving from the high of 120.91 in March 2022. This corrective phase retraces the preceding impulse wave, which spanned from the tumultuous period of April 2020 to its culmination in March 2022 at 130.91. This corrective pattern is unfolding into a double zigzag formation, with the current phase representing the final leg, denoted as wave Y of primary degree.
Considering the intermediate degree wave (B) from 67.81, it's imperative that the price does not breach 95 before initiating a downturn for the corresponding wave (C). Despite the potential completion of wave (B) at 87.63 with a double zigzag pattern, the subsequent decline appears corrective in nature, leaving room for the possibility of another upward rally, perhaps forming a triple zigzag wave (B). However, a decisive downward break from 87.63 would indicate the commencement of wave (C) with an impulse or leading diagonal pattern.
Zooming in on the H4 chart, a double zigzag formation is taking shape from 87.63, expected to conclude within the range of 79.23 to 76.90 before the price reverses direction for wave Z of (B). This constitutes the first scenario. Alternatively, if wave (b) extends higher and surpasses 87.63, it would signify the completion of wave X, with wave Z poised to ascend further. The third scenario comes into play if the decline extends beyond 75.48, potentially signaling the completion of wave (B) at 87.63 and indicating a bearish outlook for wave (C).
Monitoring these scenarios on the H4 charts will provide valuable insights into the unfolding price dynamics, guiding potential trading strategies in the volatile WTI crude oil market.
WTI Elliott Wave technical analysis [Video]
Author

Peter Mathers
TradingLounge
Peter Mathers started actively trading in 1982. He began his career at Hoei and Shoin, a Japanese futures trading company.


