US August Retail Sales Preview: Can gold turn bullish on a weak print?
- Retail Sales in US is expected to decline by 0.8% in August.
- Loss of momentum in economic recovery could force Fed to delay taper.
- Gold could turn bullish again with a daily close above $1,810.

The US Census Bureau will publish the Retail Sales report for August on Thursday, September 16, at 1230 GMT. Following July's contraction of 1.1%, investors expect sales to decline by 0.8% in August. Excluding automobiles, Retail Sales are forecast to fall by only 0.1%.
Although this data by itself is not a huge market mover, investors could put a lot of emphasis on it ahead of next week's highly-anticipated FOMC meeting. Combined with the deteriorating consumer sentiment and the uninspiring August jobs report, which showed an increase of 235,000 in Nonfarm Payrolls, disappointing Retail Sales data could force the Fed's hand to delay the reduction in asset purchases.
Moreover, Tuesday's data from the US revealed that the Core Consumer Price Index (CPI) in August edged lower to 4% on a yearly basis from 4.3% in July, supporting the view that the Fed could afford to remain cautious with regards to tapering. In that case, the greenback is likely to weaken against its rivals. Following the previous week's gains, the US Dollar Index struggled to preserve its bullish momentum and continues to fluctuate around mid-92.00s.
On the other hand, a better-than-expected Retail Sales print could help the USD stay resilient against its rivals but the potential positive impact on the dollar is likely to remain short-lived.
Gold technical outlook
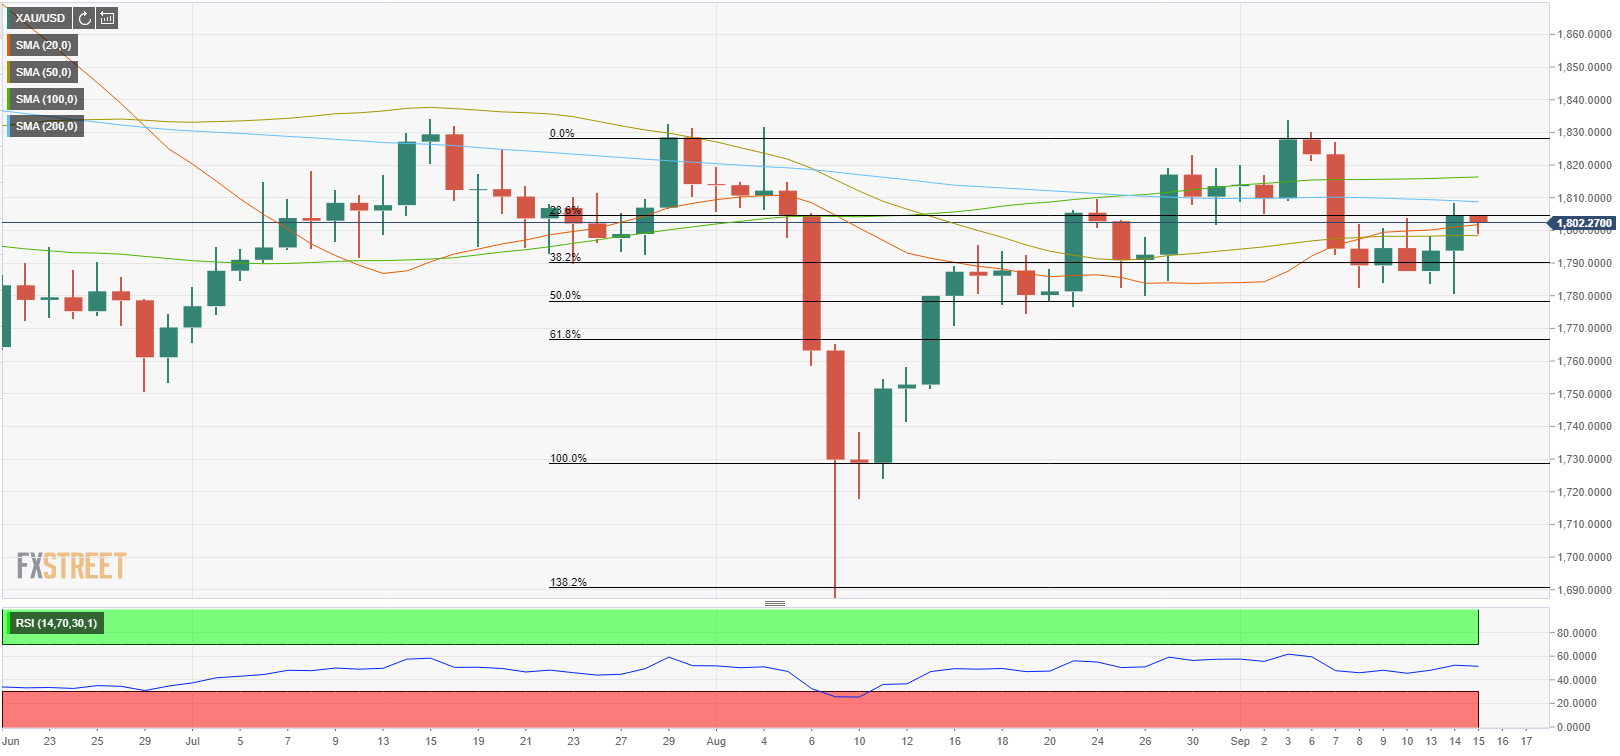
After moving sideways in a relatively tight channel below $1,800 in the previous four trading days, gold shot higher on Tuesday fueled by the sharp decline witnessed in the US Treasury bond yields and the soft inflation report. The XAU/USD pair gained 0.6% and registered its strongest daily close in a week at $1,804 before going into a consolidation phase on Wednesday.
Despite Tuesday's upsurge, the near-term outlook remains neutral for the time being. The Relative Strength Index (RSI) indicator on the daily chart is holding near 50 and XAU/USD is still trading below the 200-day SMA.
On the upside, the initial resistance is located at $1,805, where the Fibonacci 23.6% retracement of the Aug. 10 - Sep. 3 uptrend is located. Even if the pair manages to climb above that hurdle, a daily close above $1,810 (200-day SMA) is required for gold to turn bullish. $1,817 (100-day SMA) and $1,830 (static level) align as next targets.
The first technical support could be seen at $1,800 (psychological level, 50-day SMA) ahead of $1,790 (Fibonacci 38.2% retracement) and $1,780 (Fibonacci 50% retracement).
Gold daily chart
Premium
You have reached your limit of 3 free articles for this month.
Start your subscription and get access to all our original articles.
Author

Eren Sengezer
FXStreet
As an economist at heart, Eren Sengezer specializes in the assessment of the short-term and long-term impacts of macroeconomic data, central bank policies and political developments on financial assets.


