GBP/USD 1H Chart: Double Top
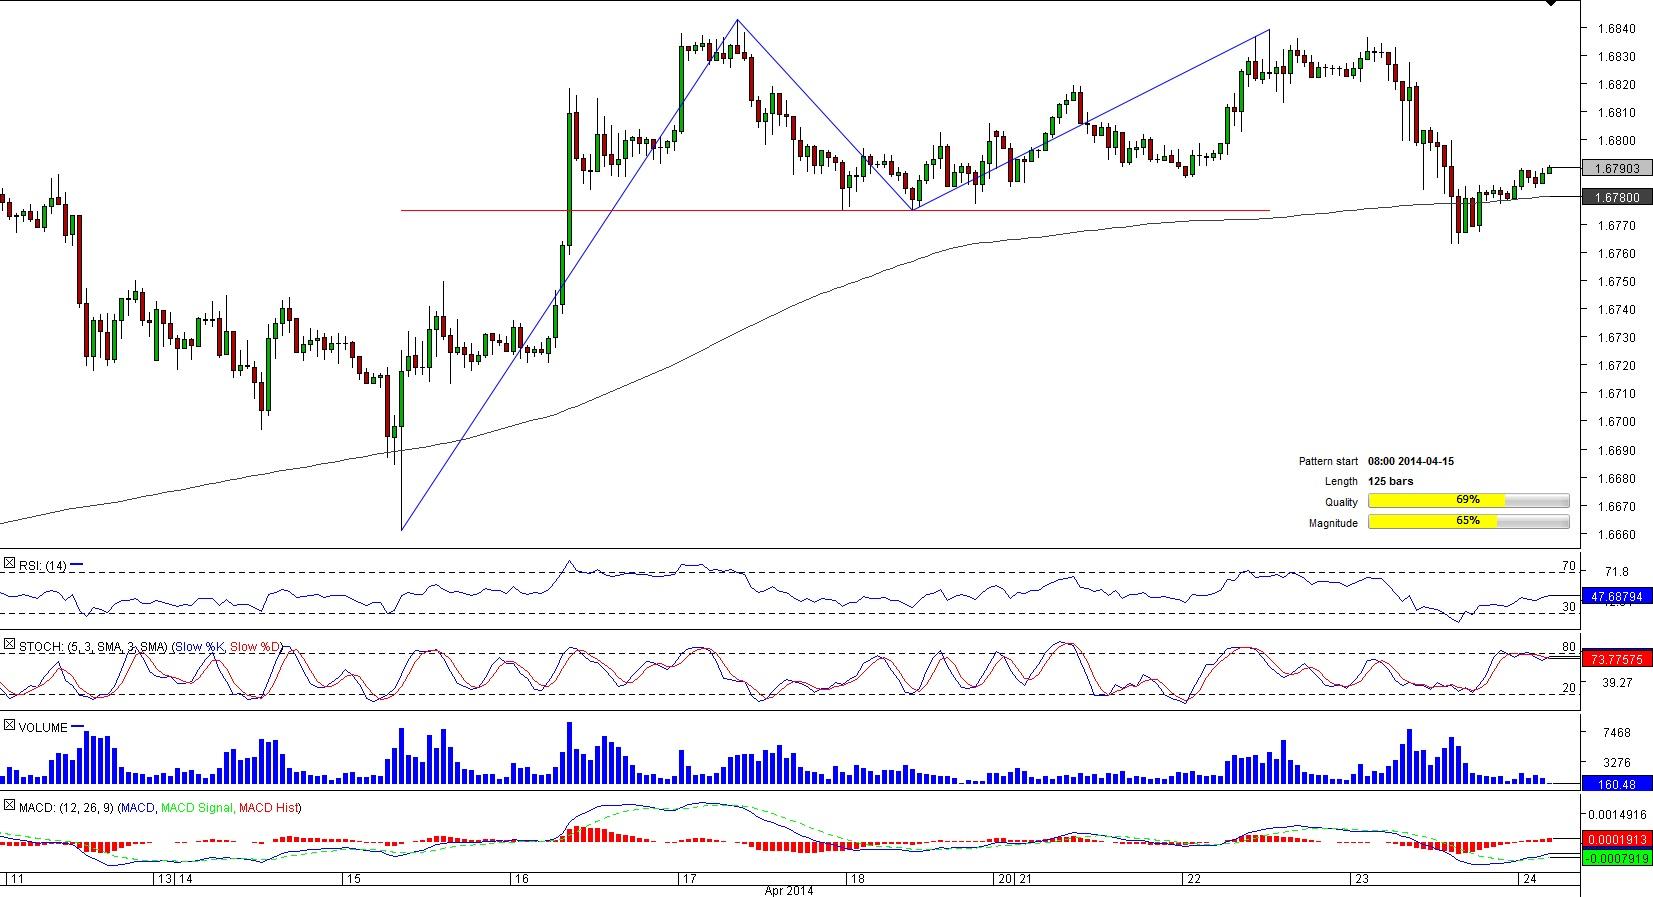
Comment: Since late March, the British Pound has been rallying against the U.S. Dollar. The longlasting climb took the pair to a fiveyear high of 1.6843 in the second part of April; this high now acts as one of the peaks of the 125-bar long double top pattern that has been being formed during the rise.
Now GBP/USD is sitting slightly above the neck-line at 1.6774 and the 200- hour SMA at 1.6780 that represent strong support levels. If the pair continues to appreciate, it is likely to near the daily pivot point at 1.6794, a jump above which will send GBP/USD to the 50-hour SMA at 1.6807 thus questioning if the pair is going to break out of the pattern soon.
USD/NOK 1H Chart: Broadening Rising Wedge
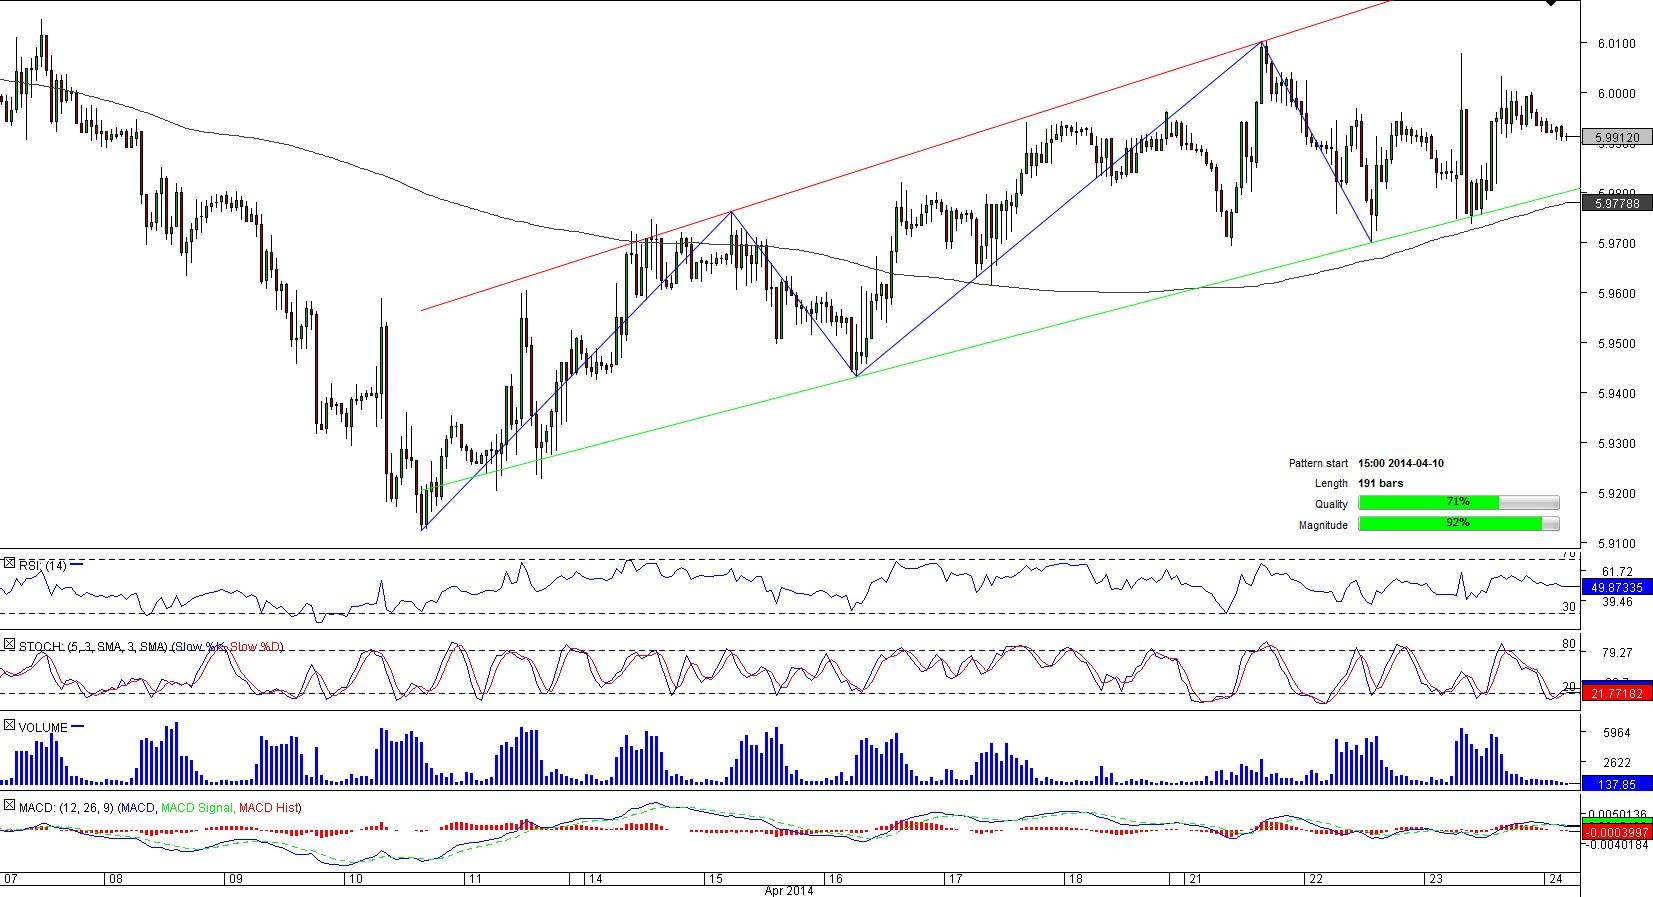
Comment: After a drop to a one-month low of 5.9126, USD/NOK reversed its trend and entered a bullish channel. The currency couple has been a subject to buying pressure for more than 190 hours; however, now there are some signs that the instrument is willing to end its winning streak. According to the SWFX numbers, market players are bearish on the pair in 71% of cases. To confirm the traders’ view, the pair has to retreat from the daily pivot at 5.9919 to the 50-hour SMA at 5.9889. In case the short-term SMA fails to contain the decline, the currency couple may even try to target the pattern’s support at 5.9796.
USD/RUB 4H Chart: Channel Up
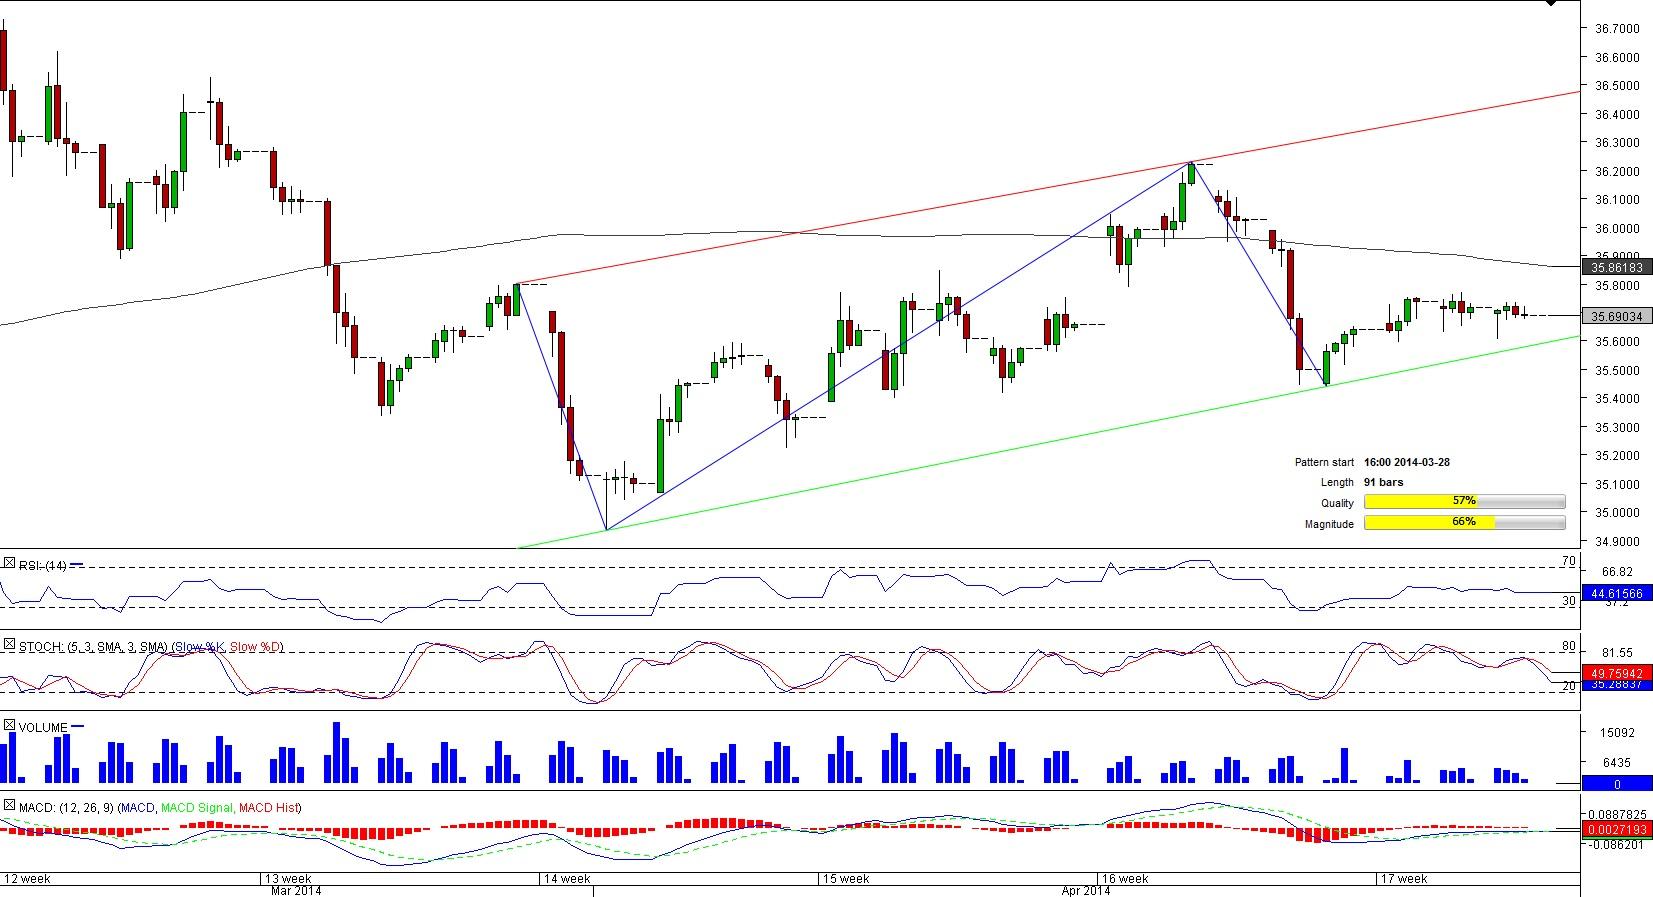
Comment: Having hit a five-year high of 36.8866, USD/RUB lost some ground but the weakness was short-lived as shortly after a drop to a six-week low of 34.9468 the pair embarked upon formation of the bullish corridor. Given escalating tensions in Ukraine, the pair is likely to remain highly vulnerable to fundamentals. However, technical data also should not be neglected. Technical indicators are neutral for short and medium terms but send a bullish signal for a long-term. Another factor worth looking at is market sentiment that contradicts to the technical signals. The SWFX data shows that about 70% of traders bet on further depreciation of the pair.
NZD/CAD 4H Chart: Triangle
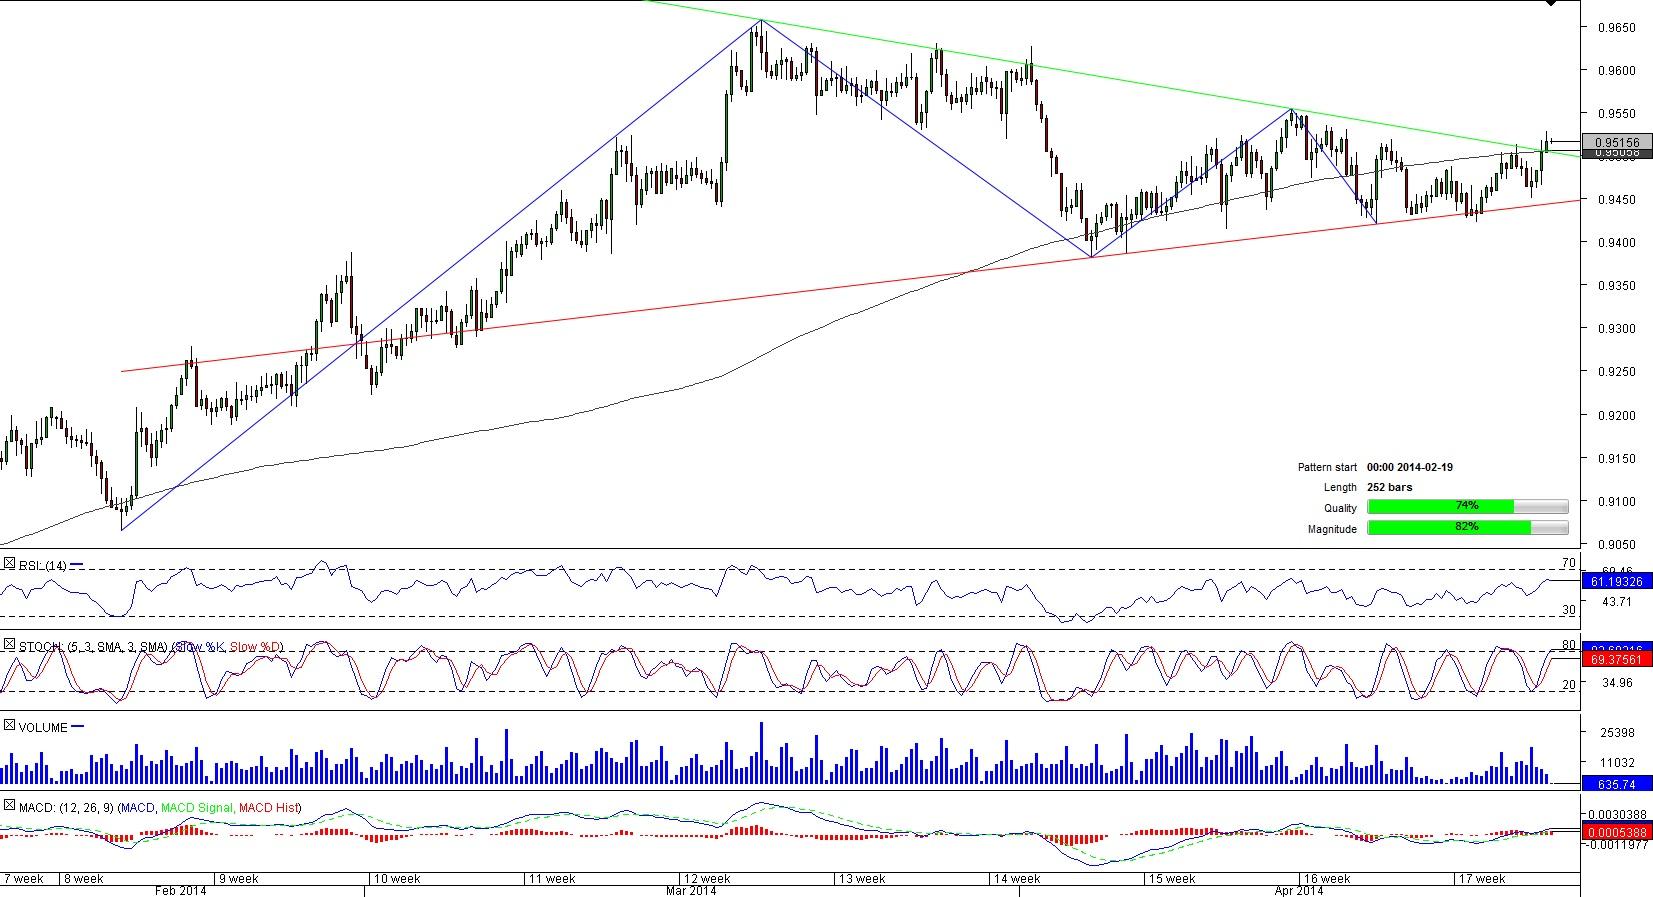
Comment: NZD/CAD was locked between two gradually converging lines during more than two months ended April 24 when the pair broke through the upper limit of the 252-bar long triangle pattern.
Now is the right time to make some profit on the pair, as a bullish breakout from a triangle pattern usually leads to an accelerating advancement of the instrument. If these ideas come true, the pair may sequentially target three important resistance zones at 0.9528/9 (four-hour R1, daily R1), 0.9540/56 (four-hour R2, R3; daily R2) and 0.9595 (daily R3). In case the pair succeeds in overcoming these levels, a five-year high at 0.9661 will seem more attainable.
This overview can be used only for informational purposes. Dukascopy SA is not responsible for any losses arising from any investment based on any recommendation, forecast or other information herein contained.
Recommended Content
Editors’ Picks
AUD/USD regains the constructive outlook above the 200-day SMA

AUD/USD advanced strongly for the second session in a row, this time extending the recovery to the upper 0.6500s and shifting its focus to the weekly highs in the 0.6580-0.6585 band, an area coincident with the 100-day SMA.
EUR/USD keeps the bullish performance above 1.0700

The continuation of the sell-off in the Greenback in the wake of the FOMC gathering helped EUR/USD extend its bounce off Wednesday’s lows near 1.0650, advancing past the 1.0700 hurdle ahead of the crucial release of US NFP on Friday.
Gold stuck around $2,300 as market players lack directional conviction

Gold extended its daily slide and dropped below $2,290 in the second half of the day on Thursday. The benchmark 10-year US Treasury bond yield erased its daily losses after US data, causing XAU/USD to stretch lower ahead of Friday's US jobs data.
Bitcoin price rises 5% as BlackRock anticipates a new wave of capital inflows into BTC ETFs from investors

Bitcoin (BTC) price slid to the depths of $56,552 on Wednesday as the cryptocurrency market tried to front run the Federal Open Market Committee (FOMC) meeting. The flash crash saw millions in positions get liquidated.
FOMC in the rear-view mirror – NFP eyed

The update from May’s FOMC rate announcement proved more dovish than expected, which naturally weighed on the US dollar (sending the DXY to lows of 105.44) and US yields, as well as, initially at least, underpinning major US equity indices.


