The Chart of the Week: No gift from Santa this year for GBP/USD bulls
- GBP/USD's heavy technical outlook from a near term perspective dominates for the last week before Xmas.
- A top-down analysis offers a comprehensive insight to both the near term and medium-term trajectory for the pair.

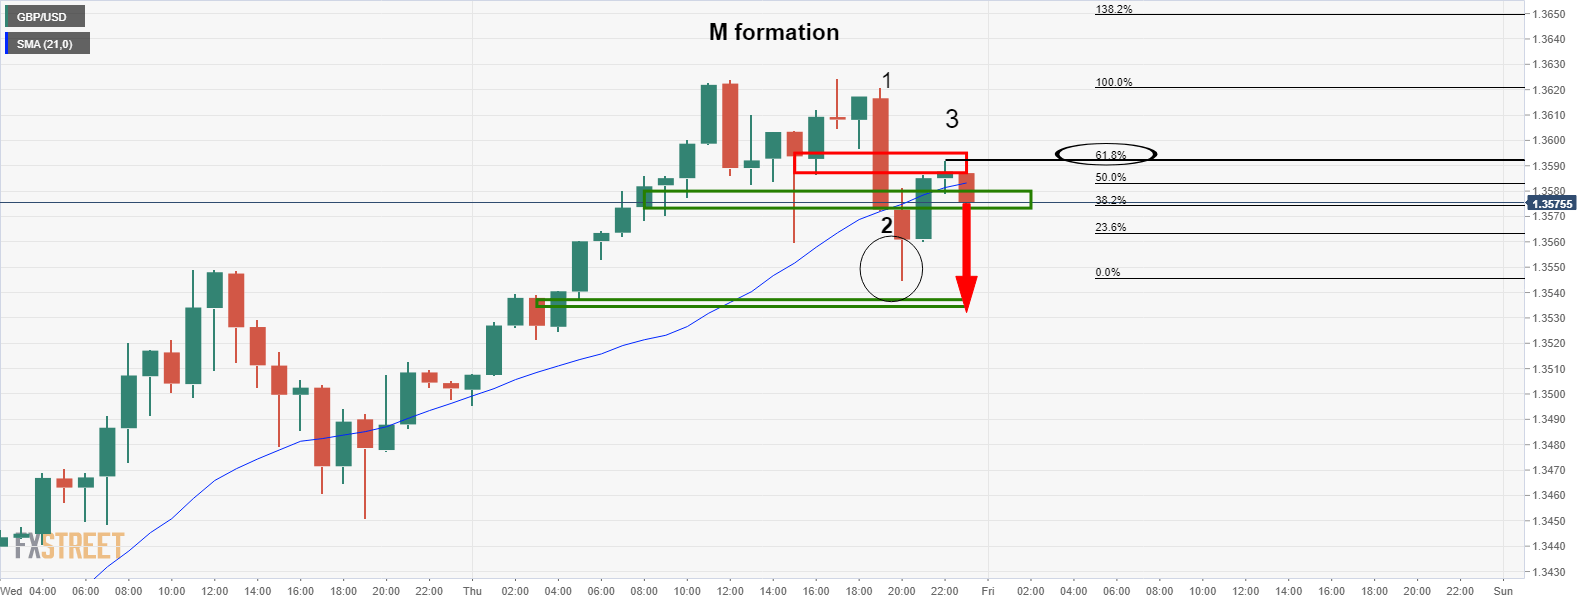
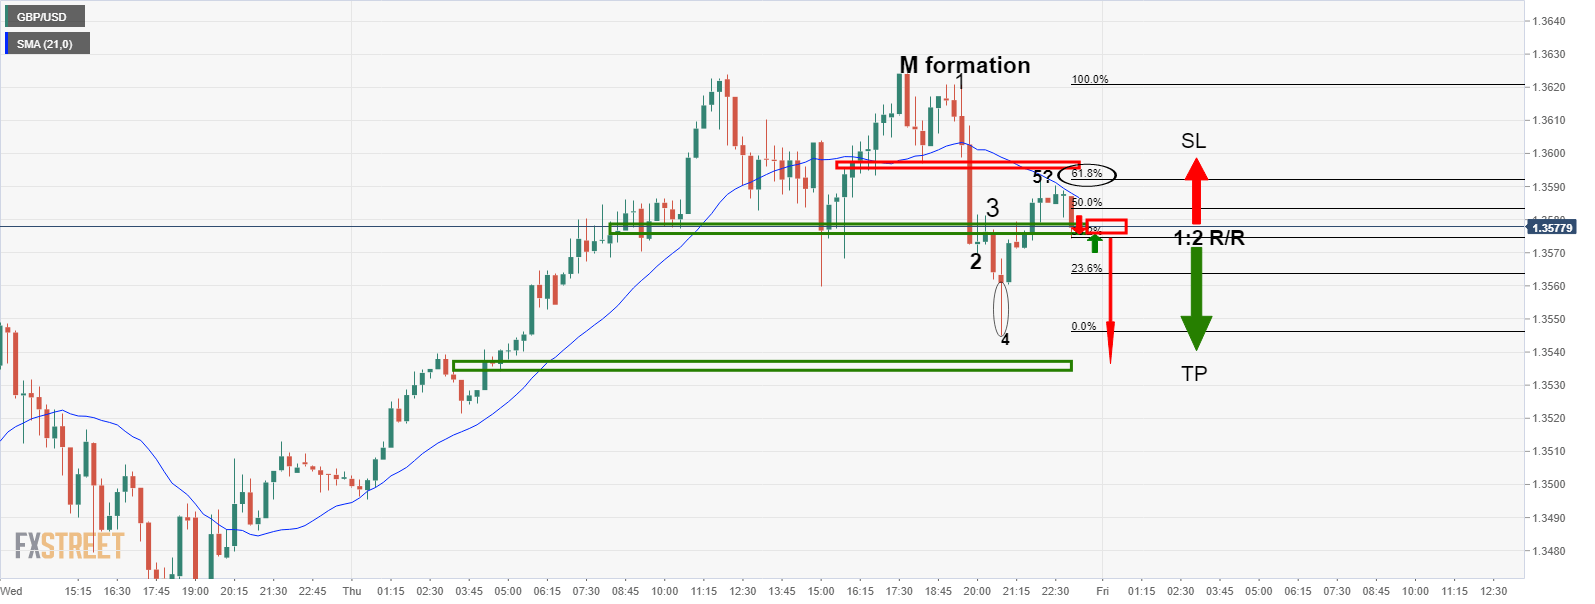
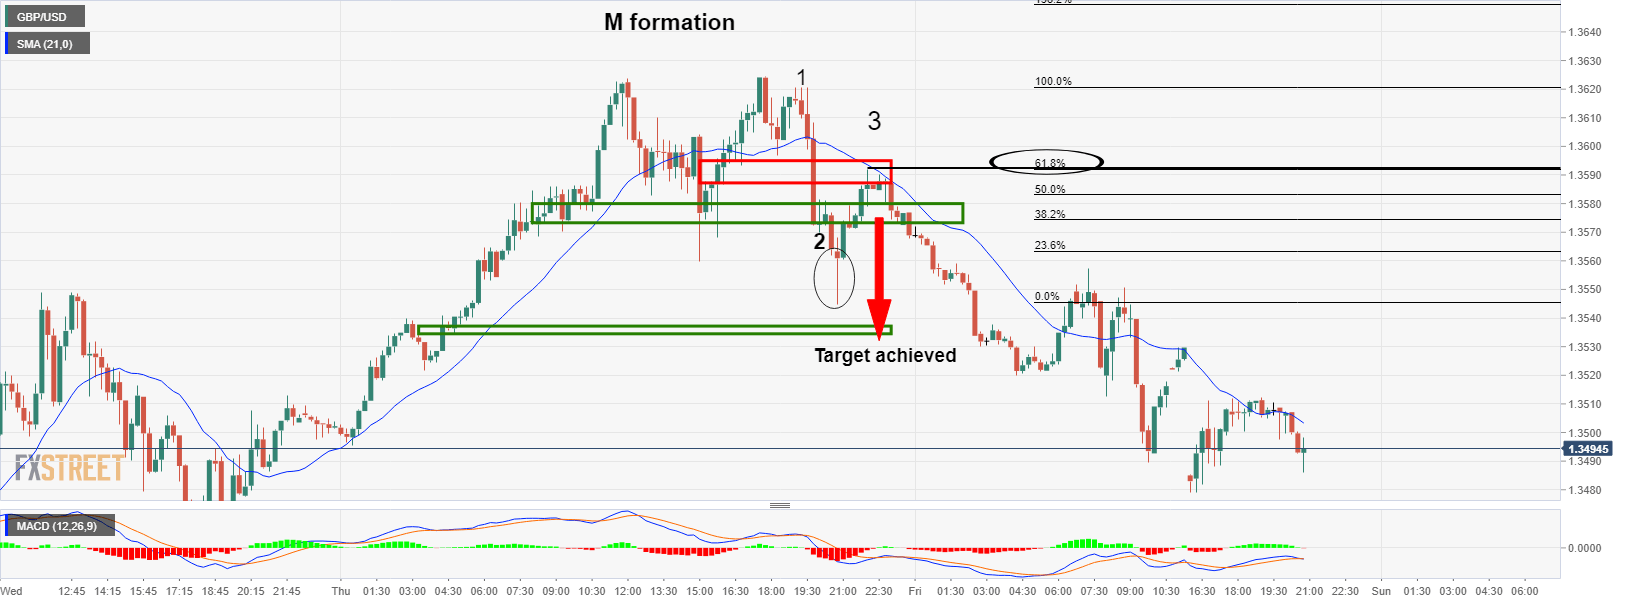
In a follow up to the last week's day trading set-up, GBP/USD Price Analysis: 1:2 risk to reward trade setup in the making, where the day trading target was achieved, the pair has continued to decline.

Price extension
The price extended into liquidity to form what could be the makings of a 4-hour head & shoulders for which traders can use as a benchmark for lower prices this week.
Moreover, if last weekend's opening gap is anything to go by, then there could be around 100 pips at stake, exposing the mid-Dec structure between 1.3445 and 1.3395 session liquidity.
In a fundamental update from the weekend news, in an article written here, it was explained that from a volume profile analysis, 1.3323 marks the naked point of control for 14th December's business.
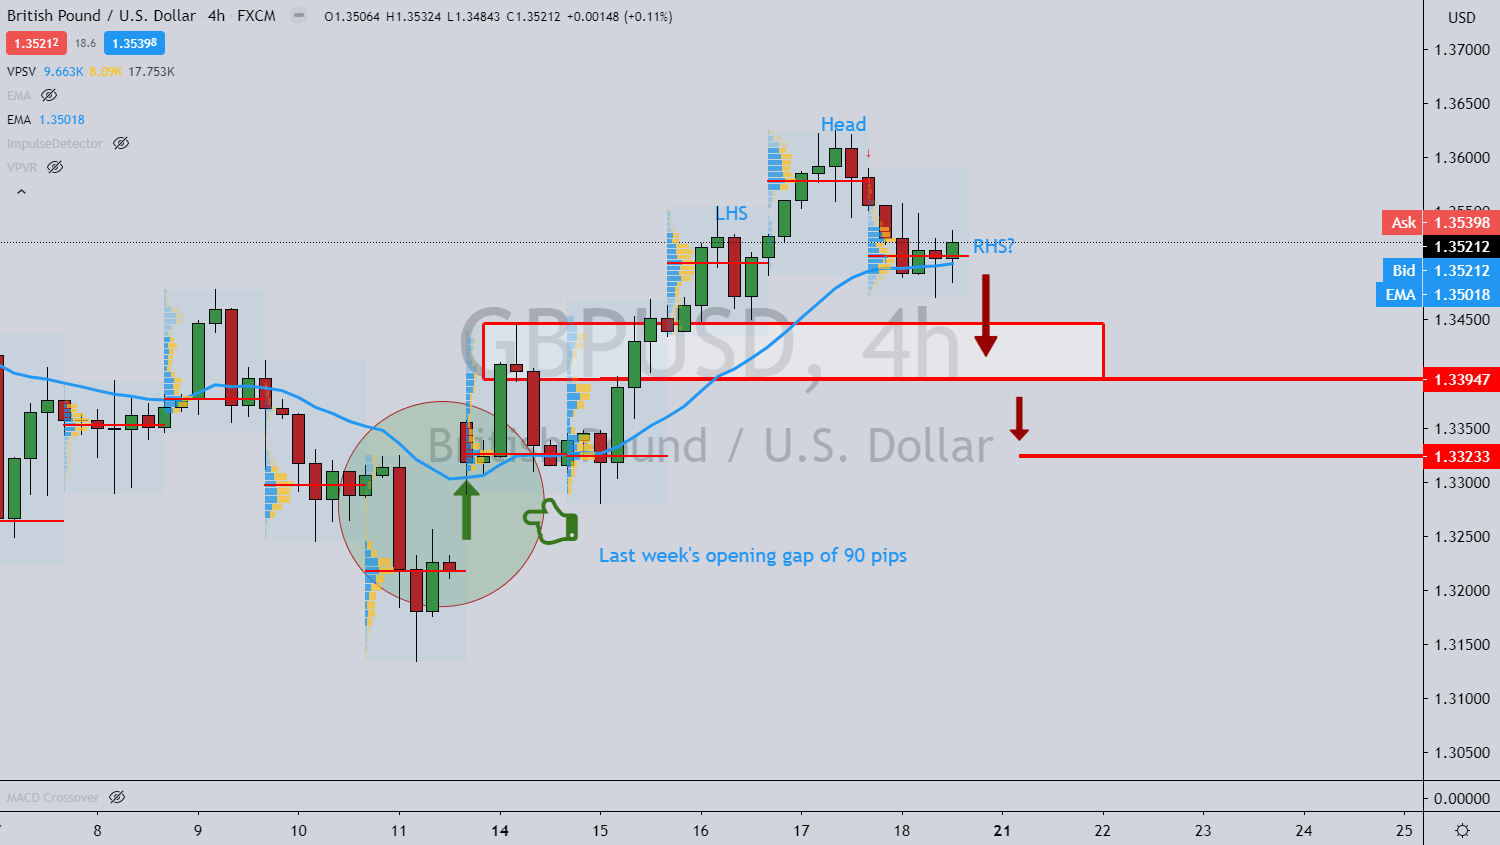
The following chart illustrates the precision of the price forecast for the open:
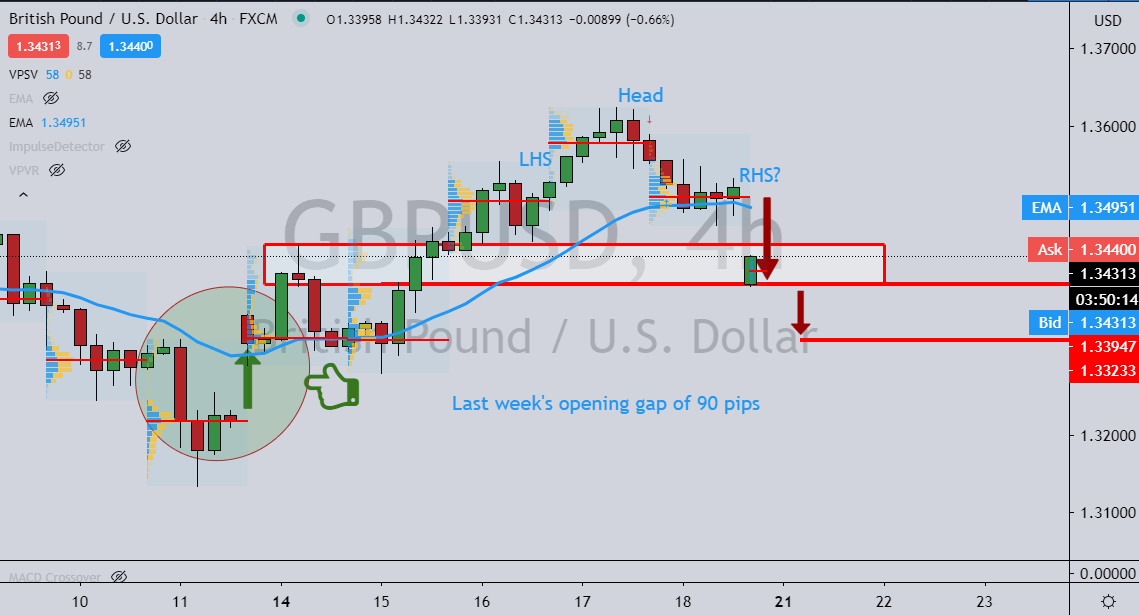
For the day ahead, there could be an opportunity to fade rallies closing the gap on an hourly time-frame basis.
FX positioning favours downside
The deterioration in sentiment and another deadline missed has since seen the latest data trimming longs by 2K according to the weekly FX positioning data for the week ending December 15, 2020.
This follows the data for the week ending 8 December, US Commodity Futures Trading Commission (CFTC) data, the biggest move was recorded in GBP.
GBP experienced a large short-squeeze due to what had been improving Brexit-related sentiment resulting in the positioning gauge jumping into positive territory, (+4% of open interest) for the first time since late September.
Daily chart
Meanwhile, from a daily perspective, we would expect to see a retest of the prior resistance structure and at least the completion of a 38.2% Fibonacci of the latest bullish impulse:
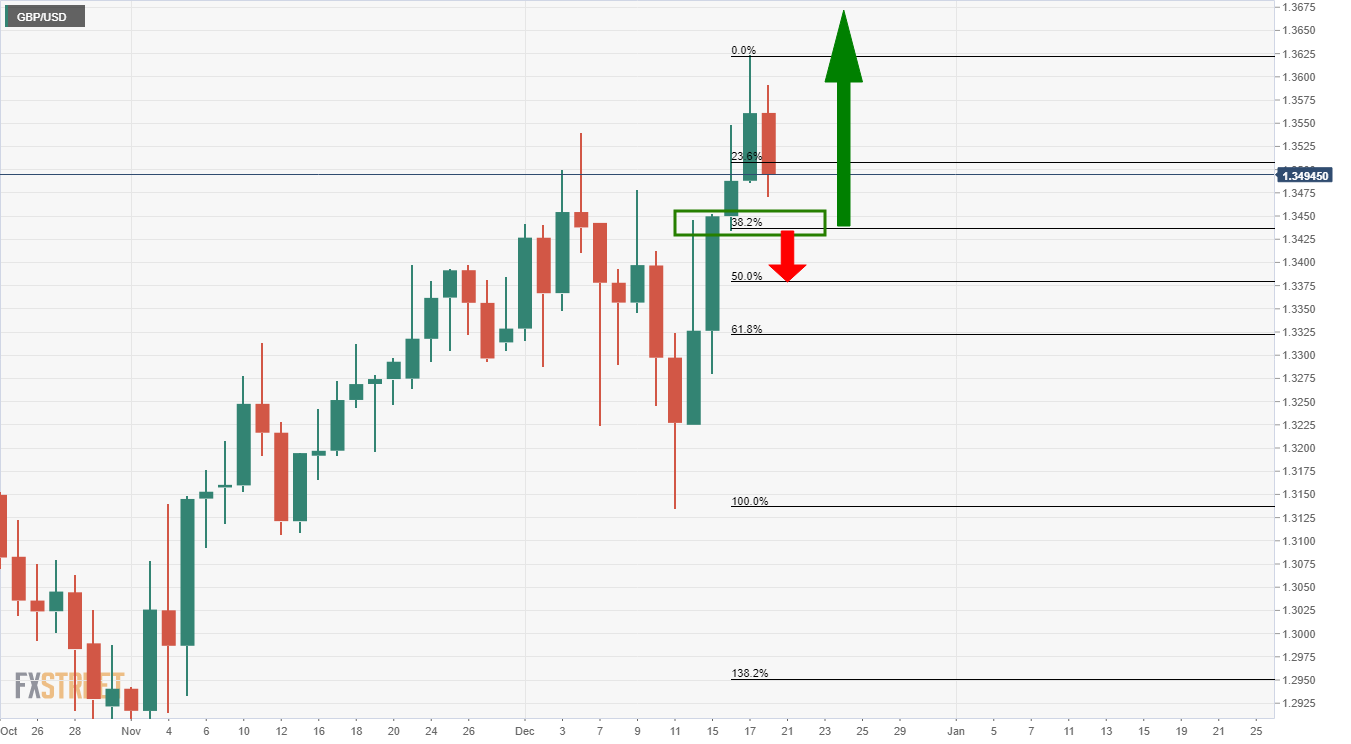
A break below the 38.2% Fibo exposes structure lower down that meets a 50% mean reversion target around the round 1.3380, an area that has confluence with weekly structure:
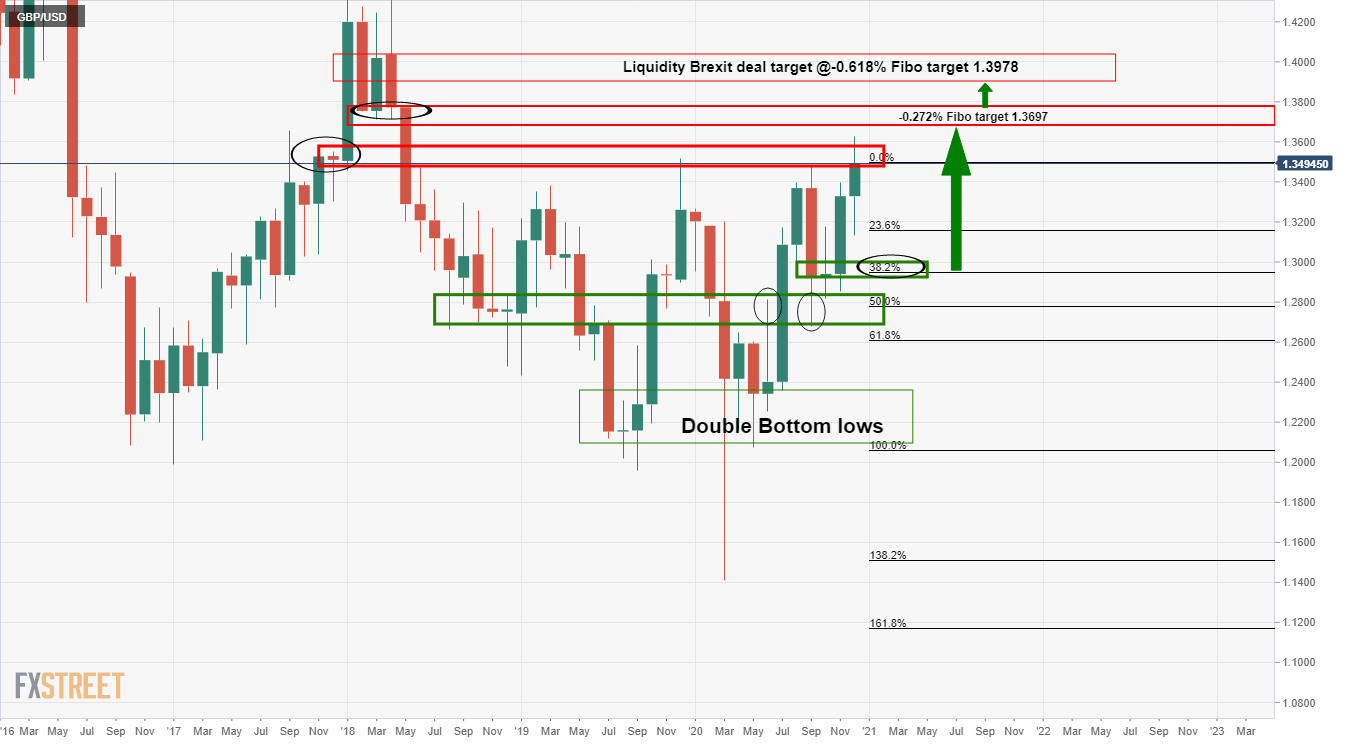
Weekly chart

Monthly Brexit deal target
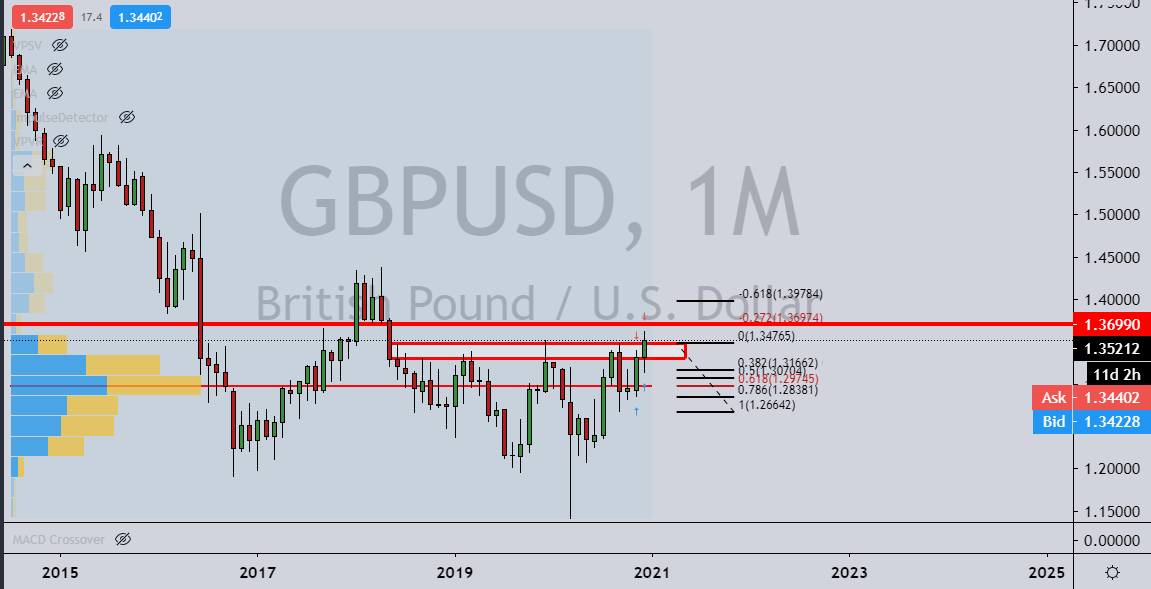
Monthly chart
From a monthly perspective, cable still has not reached the -0.272% Fibonacci of the monthly correction's range.
This would be expected to be achieved following a correction from within the current monthly impulse extension of the double bottom lows.
If there is to be a Brexit deal, then the higher levels of volumes are into the 1.40 area. A -0.618% Fibo target comes in just below the figure.
However, on failures to break the current resistance and due to ongoing uncertainty, below the -0.272% Fibonacci of the monthly target, the bias leans to a test of the point of control of the 2014-YTD range down around 1.2975.
Premium
You have reached your limit of 3 free articles for this month.
Start your subscription and get access to all our original articles.
Author

Ross J Burland
FXStreet
Ross J Burland, born in England, UK, is a sportsman at heart. He played Rugby and Judo for his county, Kent and the South East of England Rugby team.