Technical Market Outlook and Review for 27 January

EUR/USD
The US Dollar Index staged a spirited rebound on Thursday, shaping a daily bullish engulfing formation off daily Quasimodo support at 101.65 on the back of stronger-than-anticipated US growth data. Europe’s single currency consequently fell victim to the dollar upside, down 0.5% at the close of European trading.
Where does this leave the EUR/USD currency pair?
The downside movement in price is unlikely to surprise technical traders, particularly those who take into consideration the higher timeframes. The research team noted the following in recent research concerning the bigger picture (italics):
The weekly timeframe has been entrenched within a downtrend since topping in 2021 and the pullback off the late September lows at $0.9536 might be viewed as a long-term sell-on-rally opportunity. Hence, the Quasimodo support-turned resistance at $1.0888 recently entering the frame will be key to monitor as rupturing the level exposes resistance coming in at $1.1174.
On the daily chart, however, an uptrend is clear through the series of higher highs/lows, as well as price crossing above its 200-day simple moving average, currently fluctuating around $1.0309. We can also see that the moving average is starting to level off from its down move: another sign of a potential trend reversal to the upside. The Relative Strength Index (RSI), nonetheless, is seen printing early negative divergence, effectively backing a downside move from the daily prime resistance that converges with weekly resistance at $1.0954-1.0864.
Against the backdrop of the higher timeframes, the H1 timeframe is poised to form what is known as an Adam and Eve double-top pattern just shy of resistance coming in at $1.0934. As evident from the chart, the bearish showing in recent trading hauled the pair south of the $1.09 big figure. Continued underperformance opens the door for a break of the double-top pattern’s neckline at $1.0835, a move shining light on the $1.08 handle.
The $1.09 whipsaw, which saw the early double-top form (we need to close below the neckline to confirm and complete), together with weekly and daily resistances in play, could inspire a bearish showing over the coming days. Should a $1.09 retest unfold, short-term bears, therefore, may step forward as they attempt to secure a more favourable price in anticipation of the double-top pattern completing. Alternatively, drilling through the double-top pattern’s neckline unearths a short-term bearish breakout scenario in the direction of at least $1.08.

S&P 500
Major US equity indices remain in favour and on track to pencil in robust weekly gains across the board, boosted amid hotter-than-anticipated US growth data.
Leaving the monthly scale aside—dominant uptrend since early 2009—the weekly chart draws eyes to trendline resistance, sketched from the high at 4,818. On track to forge a close north of the aforementioned trendline resistance, this indicates buyers are looking to change gears and perhaps pursue higher terrain, in line with the monthly timeframe’s longer-term uptrend.
Bolstering the bullish case, the daily timeframe had price movement breach and retest the 200-day simple moving average at 3,959 this week. Holding above this dynamic value throws resistance from 4,087 into the mix. Harmonic traders might also note the possible AB=CD bearish formation at 4,137, marked by a 100% projection, and a nearby 78.6% Fibonacci retracement ratio at 4,146.
Shifting to the H1 chart, Quasimodo resistance made a show at 4,050 on Thursday, following a sharp U-turn from neighbouring support at 3,950. Understanding the position of the index on the higher timeframes, rupturing 4,050 is perhaps on the table, action unlocking the door to daily resistance mentioned above at 4,087. Given this, it remains a buyers’ market for the time being with short-term breakout buyers likely aiming to take on space north of 4,050, targeting daily resistance.
Monthly, Weekly and Daily Charts:

H1 Chart:

XAU/USD (Gold)
Momentum to the upside has clearly slowed in recent days, despite the strong-willed advance since November 2022 (+17.2%). The tentative price action is made clear through both weekly and daily movement; the former remains unchanged on the week while the latter is struggling to step higher. Adding to this, the Relative Strength Index (RSI) on both the weekly and daily charts are at the overbought threshold (in fact, the daily timeframe is also printing early negative divergence).
However, the trend is still north. This is reinforced by the weekly timeframe’s price action retesting support at $1,916 and scope seen to run for Quasimodo resistance at $1,966 on the daily timeframe. The fact we have bearish factors to consider, though, retesting the decision point at $1,867-1,886 on the daily scale remains a possibility and a location longer-term dip-buyers may emerge from.
On the H1 scale, a rising wedge formed from between $1,929 and $1,896. Aside from a minor break to the upside, things recently turned sour and a breakout south unfolded, which has price retesting the underside of the breached line, as we write. This paves the way for a bearish assault on trendline support, extended from the low $1,797.
Overall, this is an interesting market. On the one hand, momentum has decreased, though on the other hand we still have active weekly support and room to advance on both weekly and daily timeframes. Technically, then, a short-term dip is not out of the question towards the weekly support level at $1,916 which merges with the current H1 trendline support. Therefore, convergence of these two structures could be a place buyers show, in alignment with the current uptrend.

BTC/USD
Week to date, the major crypto is 1.3% higher, marginally extending the prior week’s near-9% run.
In terms of weekly price action, the research team noted the following (italics):
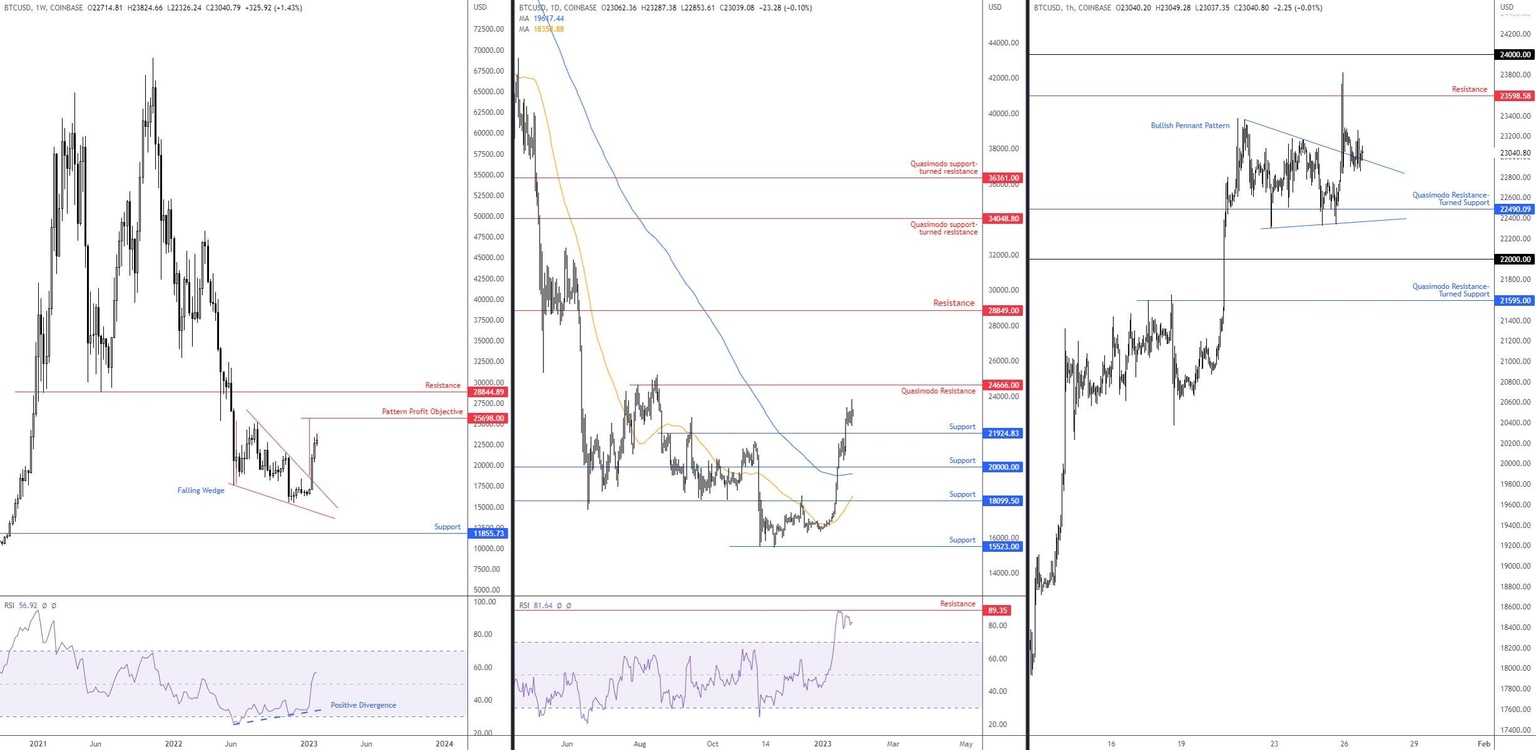
Price action on the weekly timeframe gained some grip north of support at $11,855 and hammered through the upper limit of a falling wedge pattern (reversal structure), drawn between $25,214 and $17,567. You will note this was accompanied by the Relative Strength Index (RSI) chalking up positive divergence ahead of oversold territory (the indicator also recently crossed above its 50.00 centreline [positive momentum]). Aside from the local price tops (evident on the daily chart), the falling wedge pattern profit objective is set at $25,698, closely trailed by resistance at $28,844.
The daily timeframe has shown limited change since the last report, therefore the following may serve as a reminder of where the team left the daily scale (italics):
The daily timeframe shows the price of the major cryptocurrency convincingly scaled through resistance at $21,924, which is now marked as support. As of writing, the unit has overthrown the $22,800 13 September high (2022) which could pave the way for follow-through buying to as far north as Quasimodo resistance at $24,666.
Note that this level is arranged just south of the weekly timeframe’s falling wedge pattern profit objective at $25,698. But it needs to be noted that while the weekly timeframe’s RSI is exploring above its 50.00 centreline, the daily chart’s RSI confronted indicator resistance at 89.35, testing levels not seen since the beginning of 2021 (indicating a potential bearish move/correction). Still, on the daily scale, we can see that the recent outperformance in early January forged a fresh higher high (breaking the $18,385 14 December high), and crossed above both the 50-day and 200-day simple moving averages, currently trading at $18,358 and $19,617, respectively. Consequently, the trend is showing early signs of an upside reversal.
Movement on the H1 timeframe moulded what’s referred to as a bullish pennant pattern, extended between $23,363 and $22,298, which experienced an upside breakout on Wednesday to reject neighbouring resistance at $23,598. Current action has price retesting the breached pattern boundary. Technically, buyers are expected to show from either this boundary or the nearby Quasimodo resistance-turned support at $22,490. Should the unit push through $23,598 and attack $24,000, chart pattern traders will then likely look to project the bullish pennant pattern’s profit objective.
Author

Aaron Hill
FP Markets
After completing his Bachelor’s degree in English and Creative Writing in the UK, and subsequently spending a handful of years teaching English as a foreign language teacher around Asia, Aaron was introduced to financial trading,


