Disputes and De-risking: US-China trade dispute changes trade flows
The bilateral trade dispute between the US and China is entering a new round and is leading to renewed discussions about the deglobalisation of global trade in goods. While it is true that the US and China have decoupled in terms of direct trade, the rest of the world has intensified its trade relationships.
The bilateral trade dispute between the US and China is entering a new round after US President Biden announced higher tariffs under Section 301 of the Trade Act on Chinese imports worth $18 billion on 14 May, which are to come into force between 2024 and 2026. Under Section 301 of the Trade Act, the US can impose trade sanctions if a trading partner violates US trade agreements or engages in “acts that are 'unjustifiable' or 'unreasonable' and burden U.S. commerce”.
The increase in tariffs follows a four-year review which recommends that tariffs on Chinese products introduced on 6 July 2018, and 23 August 2018, should remain in place, ranging from 7.5% to 25% on Chinese imports worth some $370 billion. Overall, the report concludes that while the section 301 tariffs have been an effective tool in changing some of China’s trade policies, these policies are still a burden on US commerce. Regarding the effects on the US economy, the 2018-2019 tariffs did impact US aggregate economic welfare and real incomes slightly negatively due to less trade with China, while raising prices slightly, on average by 0.4% each year. Manufacturing employment or wages did not increase, while investment growth was slightly subdued in the short run. US production, however, did increase across industries most directly affected by the tariffs, on average by $25.6 billion between 2018 and 2021.
Seven strategic sectors are subject to higher tariffs on US imports from China
Now, products across seven sectors classified as “strategic” are affected by additional higher tariffs. However, in order not to damage national solar manufacturing, certain solar manufacturing equipment will be temporarily excluded from higher tariffs (19 items), while over 300 machinery products used in domestic manufacturing are proposed to be included in the Machinery Exclusion Process.
List of goods imported by the USA from China that are subject to additional higher tariffs
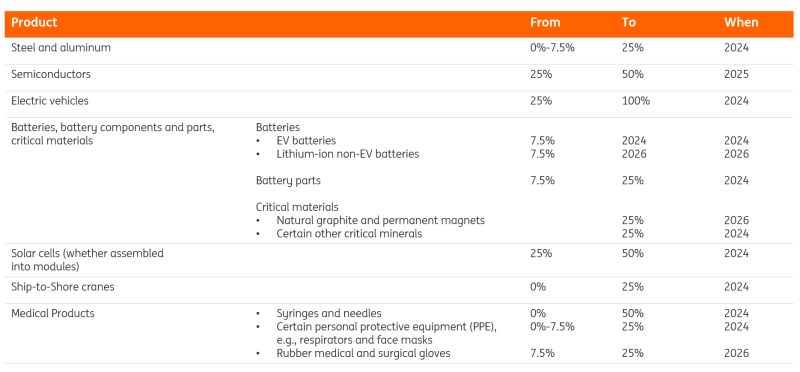
Source: White House Fact Sheet: President Biden Takes Action to Protect American Workers and Businesses from China’s Unfair Trade Practices
The tariff increases reflect the US’s priority for onshore strategic technologies and manufacturing, and the trade tension between the US and China will continue regardless of the results of the elections in November. The tariffs on electric vehicles (EVs) may have a somewhat moderate impact on the US EV market, as Chinese carmakers accounted for less than 5% of the EVs sold in the US last year. But many of the remaining tariffs, such as those on lithium-ion batteries, critical minerals, and semiconductors, could have a much larger impact on Chinese exports and the US clean energy market, with possible repercussions elsewhere. Less competition in the US could strengthen domestic supply chains, but questions remain as to how fast these supply chains can be built up and how fast cost reductions will be for certain technologies.
The US is not alone in investigating China’s trade strategy
Yet, President Biden isn’t alone in his view on unfair trade practices by China. The fear that Chinese electric vehicles could take market share from European producers triggered an intense debate last year over whether to impose additional tariffs in Europe. In October 2023, the EU Commission launched a formal investigation into whether Chinese companies are benefiting from illegal subsidies given the surge in low-priced EV imports from China into the EU. Any provisional anti-subsidy duties could be imposed 9 months after initiation but no later than 13 months. By November this year, at the latest, final action must be taken. Currently, the Chinese car manufacturers BYD, SAIC and Geely are under scrutiny, with the EU able to decide respective tariffs per producer.
We (and the facts) continue to be in camp globalisation with ever-changing supply chains
It is no wonder that in view of these headlines and, above all, actions, debate about the
de-globalisation of the world economy is on the rise. And 2023 was not a pretty year for global trade in goods. Compared to the year before, trade in goods fell by 1.7%. But despite all the shifts and changes going on and countries intensifying national action plans, the facts do not tell a story of
de-globalisation, but of ever-changing supply chains. Between 2018 and 2022, global goods trade grew on average by 2.3%, and if 2023 is included, by 1.7%. Global GDP grew by 2.4% in the period considered, e.g., only just slightly above trade growth. And even though average global GDP growth has been higher than trade in goods in recent years, the latter does not appear to be decoupling from the development of global GDP growth.
Trade in goods has moved in tandem with world GDP growth
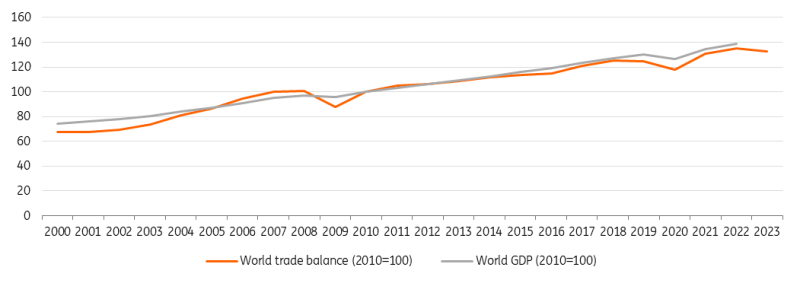
Source: LSEG Datastream, CPB, ING
Direct trade between the US and China has declined, but other trade opportunities have opened up
Although it is undoubtedly true that trade in goods between the US and China has declined, both countries have looked for other sales markets. The overall share of imports from China in total US imports fell by 7.7 percentage points between 2017 and 2023, while the share for imports of products subject to the additional tariffs as of 2018 even fell by 9.2 percentage points.
In return, however, some countries could accrue significant gains with the share of imports from the EU, Mexico and Vietnam increasing the most by 2.4pp, 2.1pp, and 2.9pp, respectively, between 2017 and 2023. Also, Taiwan and Canada increased their export market share to the US. When considering only the share for imports of products subject to the additional tariffs as of 2018, Mexico and Canada, other ASEAN countries as well as the EU and India profited from shifts due to the tariffs applied (by 4.2pp, 2.9pp, 1.3pp, and 0.6pp, respectively), according to US Census and the USTR report data.
China, on the other hand, increased its exports most to Russia, Vietnam, Africa, the EU and Mexico. Mexico and Vietnam might serve as “plus one” countries, becoming the middleman for China’s trade to the US and vice versa.
Change in total US export and import share between 2023 and 2017 by trading partner
(in percentage points, selected countries).
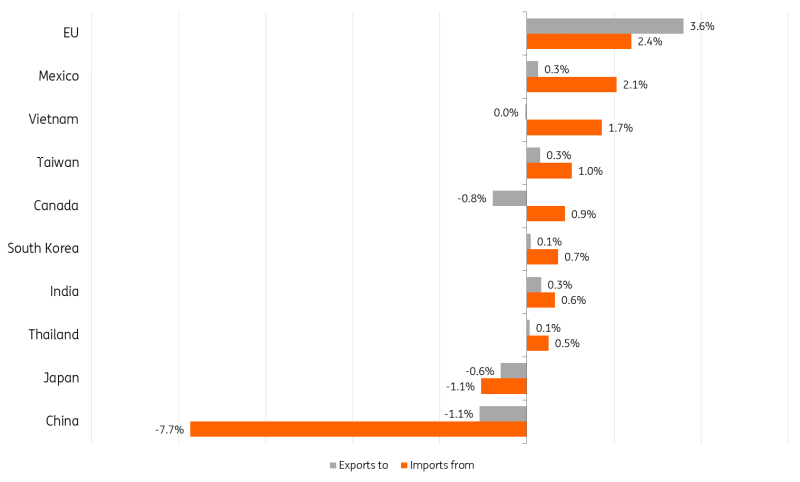
Source: LSEG Datastream, ING
Change in total China import and export share between 2023 and 2017 by trading partner
(percentage points, selected countries).
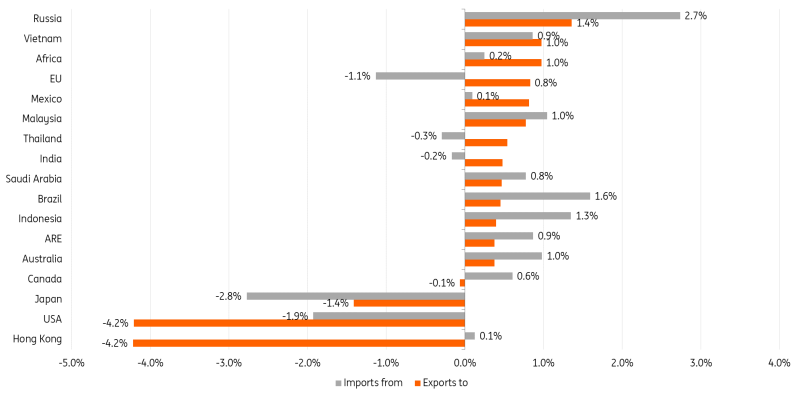
Source: LSEG Datastream, ING
In general, China’s trade profile is much more diversified than that of the EU or the US in terms of import sourcing. Only goods imported from the EU have a market share of more than 10%, followed by Taiwan (7.8%), the US (6.5%), Japan (6.3%) and Australia (6%). The additional tariffs are only likely to intensify the diversification process, which, however, started years before the escalation of the tariff conflict between the US and China.
It’s not the end of globalisation
Changes in supply chains are happening constantly. Although recent global events have spurred the desire for more self-sufficiency, and the trend toward ‘friendshoring’ and reconsidering business operations, trade flows have been diverted, not destroyed. It is true that the big blocs are trying to shield their economies more as of late. China, the EU and the US account for almost half of the industrial policy measures implemented last year, most of which are intended to strengthen strategic competitiveness but have a trade-distorting effect, according to IMF and Global Trade Alert numbers.
However, this does not necessarily create economic wealth as the evaluation of the US report on Chinese tariffs shows. With China likely to respond to the new US tariffs with retaliatory measures, we expect the moves to be rather symbolic. Overall, between an import recovery and rising pressure on exports, it is likely we will see a smaller contribution from trade to growth in China starting in the second quarter as our Chief Economist for Greater China Lynn Song expects. In any case, we expect goods flows to continue changing sources, though they will still be traded. With the ongoing diversification process set in motion by China and the US, smaller countries might benefit even more. In fact, disputes, ditches, and de-risking create new opportunities for trade, resulting in ever-changing supply chains.
Read the original analysis: Disputes and De-risking: US-China trade dispute changes trade flows
Author

ING Global Economics Team
ING Economic and Financial Analysis
From Trump to trade, FX to Brexit, ING’s global economists have it covered. Go to ING.com/THINK to stay a step ahead.


