Chainlink may have formed a higher degree bullish setup

We have been talking a lot about bullish ChainLink with ticker LINKUSD. We also shared a free chart back in November of 2023, where we mentioned and highlighted an ongoing five-wave bullish cycle from the lows.
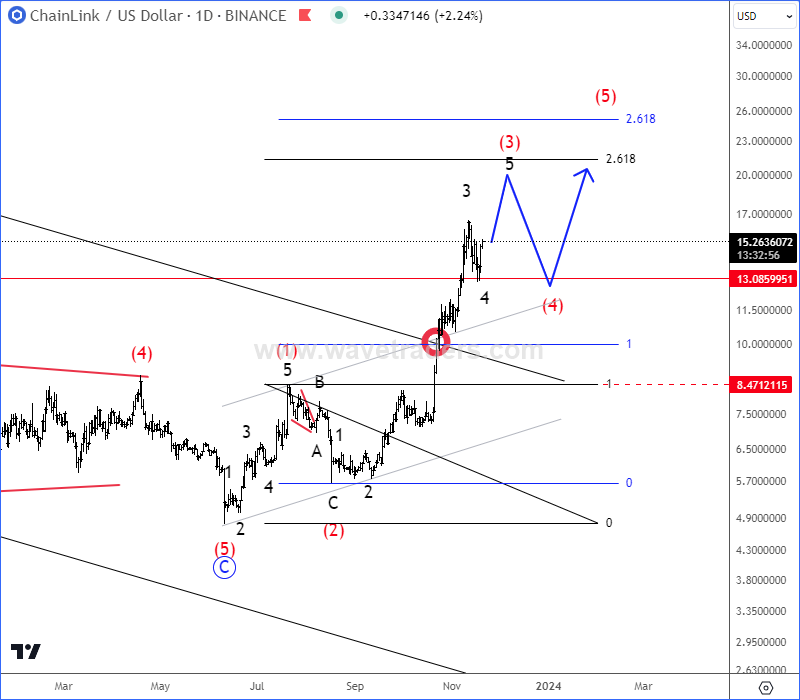
LINK/USD daily chart from November 20 2023
As you can see, LINKUSD has nicely unfolded five waves up from the lows, which is actually first higher degree leg A/1 of larger minimum three-wave A/1-B/2-C/3 rally. After completing five waves up into wave A/1, we have seen a higher degree slow down recently, which we believe it’s just an A-B-C correction within wave B/2 before a continuation higher for wave C or 3.
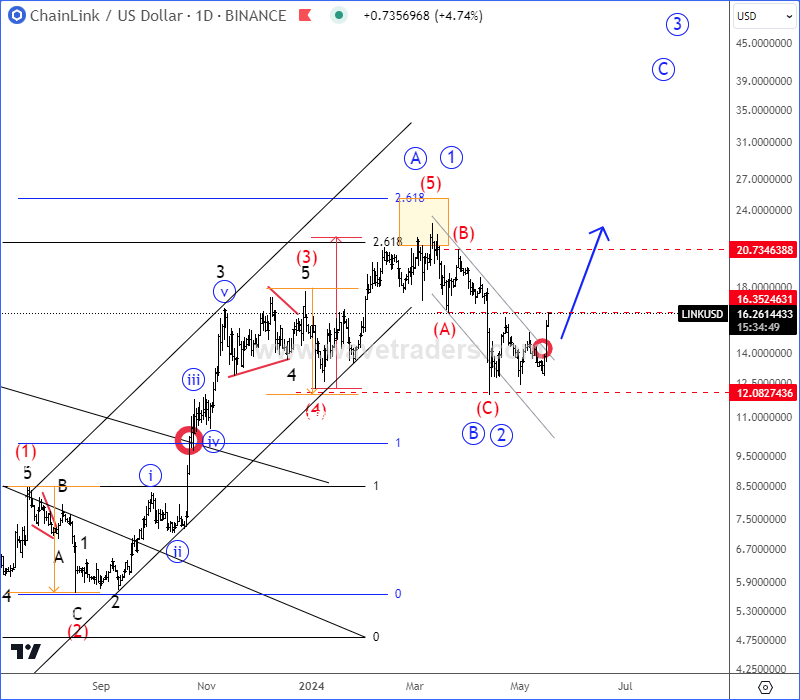
LINK/USD daily chart from May 17 2024
LINKUSD is already nicely recovering away from projected 12 support area as Chainlink races toward tokenization of funds. It’s coming back above channel resistance line after a three-wave A-B-C correction in B/2, so wave C or 3 can be actually already underway, especially if breaks above 20 bullish confirmation level.
Get Full Access To Our Premium Elliott Wave Analysis For 14 Days. Click here.
Get Full Access To Our Premium Elliott Wave Analysis For 14 Days. Click here.
Author

Gregor Horvat
Wavetraders
Experience Grega is based in Slovenia and has been in the Forex market since 2003.


