During the last few weeks the Australian dollar has done well to stop the bleeding and trade within a wide range roughly between 0.8650 and 0.88. Prior to that it had experienced a sharp decline throughout September which saw it move from close to 0.94 down to below 0.8650 and an eight month low in the process. Despite the current resistance at 0.88, it was able to move through to a two week high above 0.8900 a couple of weeks ago before recently falling sharply below 0.87 again. The resistance level at 0.88 remains a factor and is continuing to place downwards pressure on price, however more recently all eyes have turned on to the support level at 0.8650 to see if the Australian dollar can remain above it. Several weeks ago the Australian dollar found some much needed support at 0.8950 and rallied back up to just shy of the key 0.90 level before resuming its decline. The long term key level at 0.90 was called upon to desperately provide some much needed support to the Australian dollar, which it did a little a few weeks ago, however it has more recently provided resistance.
Back at the beginning of September the Australian dollar showed some positive signs as it surged higher again bouncing off support below 0.93 and reaching a new four week high around 0.94 however that all now seems a distant memory. The Australian dollar reached a three week high just shy of 0.9480 at the end of July after it enjoyed a solid period which saw it surge higher through the resistance level at 0.9425 to the three week around 0.9480, before easing back towards that level. The Australian dollar enjoyed a solid surge higher reaching a new eight month high above 0.95 at the end of June, only to return most of its gains in very quick time to finish out that week. Since the middle of June the Australian dollar has made repeated attempts to break through the resistance level around 0.9425, however despite its best efforts it was rejected every time as the key level continued to stand tall, even though it has allowed the small excursion to above 0.95.
After the Australian dollar had enjoyed a solid surge in the first couple of weeks of June which returned it to the resistance level around 0.9425, it then fell sharply away from this level back to a one week low around 0.9330 before rallying higher yet again. Its recent surge higher to the resistance level around 0.9425 was after spending a couple of weeks at the end of May trading near and finding support at 0.9220. Throughout April and into May the Australian dollar drifted lower from resistance just below 0.95 after reaching a six month high in that area and down to the recent key level at 0.93 before falling lower. During this similar period the 0.93 level has become very significant as it has provided stiff resistance for some time. The Australian dollar appeared to be well settled around 0.93 which has illustrated the strong resurgence it has experienced throughout this year.
There’s a limit to what the Reserve Bank of Australia or, for that matter, any central bank can do. It couldn’t, for example, stop the number of unemployed from rising by 150,000 over the past two and a half years or, presumably, it would have done so. And, now that the unemployment rate has risen, from 5.1 per cent to 6.1 per cent over that time, the RBA can’t wave its magic wand and make it go straight back down again. Instead, according to the minutes of its monthly monetary policy meeting, the RBA’s board concluded that “it would probably be some time before the unemployment rate declined consistently”. It would be nice if the RBA could keep unemployment at rock bottom year in, year out, but there was always going to be a risk that it would rise as the mining investment boom faded. There comes a point, one reached by the RBA late last year, when the only option for a central bank is to sit back and wait for the economy to pick up. In the meantime, it will cross its fingers and hope its monetary policy settings are right.
(Daily chart / 4 hourly chart below)
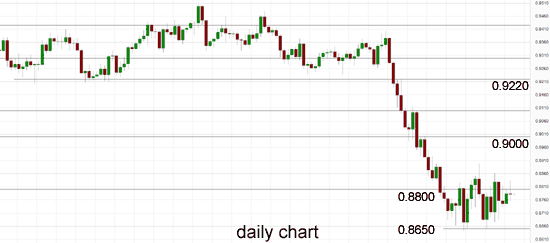
AUD/USD October 21 at 22:50 GMT 0.8780 H: 0.8784 L: 0.8777
AUD/USD Technical

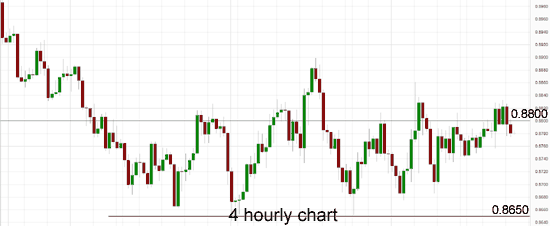
During the early hours of the Asian trading session on Wednesday, the AUD/USD is remaining very steady below the resistance at 0.8800 again after finishing last week meeting significant resistance there. The Australian dollar was in a free-fall for a lot of last year falling close to 20 cents and it has done very well to recover slightly to near 0.95 again earlier this year. Current range: trading right around 0.8780.
Further levels in both directions:
- Below: 0.8650.
- Above: 0.8800, 0.9000, and 0.9100.
Recommended Content
Editors’ Picks
AUD/USD regains the constructive outlook above the 200-day SMA

AUD/USD advanced strongly for the second session in a row, this time extending the recovery to the upper 0.6500s and shifting its focus to the weekly highs in the 0.6580-0.6585 band, an area coincident with the 100-day SMA.
EUR/USD recovers to top end of consolidation ahead of Friday’s US NFP

EUR/USD drove back to the top end of recent consolidation on Thursday, recovering chart territory north of the 1.0700 handle as market risk appetite regains balance heading into another US Nonfarm Payrolls Friday.
Gold price pullback on Fed hawkish tilt amidst lower US yields, weaker US Dollar

Gold price clings to the $2,300 figure in the mid-North American session on Thursday amid an upbeat market sentiment, falling US Treasury yields, and a softer US Dollar. Traders are still digesting Wednesday’s comments of the Fed’s Chair, Jerome Powell, and the US central bank's decision to hold rates unchanged.
Bitcoin price rises 5% as BlackRock anticipates a new wave of capital inflows into BTC ETFs from investors

Bitcoin (BTC) price slid to the depths of $56,552 on Wednesday as the cryptocurrency market tried to front run the Federal Open Market Committee (FOMC) meeting. The flash crash saw millions in positions get liquidated.
FOMC in the rear-view mirror – NFP eyed

The update from May’s FOMC rate announcement proved more dovish than expected, which naturally weighed on the US dollar (sending the DXY to lows of 105.44) and US yields, as well as, initially at least, underpinning major US equity indices.