Risk appetite improves as bond markets look to stabilise

Market Overview
With bond markets settling down, a degree of calm has begun to form. The flight into safety that arose from fear of the implications of a key part of the US Treasury yield curve inverting (the 3 month to 10 year spread went negative for the first time since 2007) has just dissipated slightly. However, there will still be keen emphasis on economic data releases out of the US, with the focus today on US Consumer Confidence. According to Chicago Fed President Charles Evans there is just a 25% probability of a US recession, but a deterioration in consumer confidence (the consumer is around 70% of the US economy) could begin to stoke fears once more. For this morning, equities are relatively stable in support, whilst there is little real direction on forex markets (aside from a shade of improvement on risk appetite). The calamity of Brexit took another step forward last night as the UK Parliament voted to take control away from the shambles of a Government in an attempt to find a solution to the conundrum. The next day of Parliamentary volatility is likely to be Wednesday now. The fact that over 70% of the House of Commons MPs is made up of “remainers” suggests a softer Brexit is still a likely direction. Sterling holding around $1.3200 against the dollar ($1.3000 seems to be a line in the sand for traders) would suggest so too.

Wall Street closed mixed with the S&P 500 a couple of ticks off at 2798 whilst US futures are ticking back up again by +0.2% today. Asian markets have been mixed overnight with the Nikkei +2.1% whilst the Shanghai Composite was -1.7%. European markets are showing stabilisation to follow Wall Street, with FTSE futures and DAX futures both around +0.2% higher. In forex majors, the main mover is a slip back on the safe haven yen, whilst the euro and sterling trade around the flat line and the higher risk Aussie is ticking stronger. Better risk appetite is showing across the commodities, with gold a touch lower and oil finding its feet again.
It is a US heavy day for the economic calendar which does little until the US Building Permits for February at 1230GMT which are expected to drop back to 1.30m (from 1.32m in January), with US Housing Starts down to 1.21m (from 1.23m in January). The S&P Case Shiller House Price Index at 1400GMT is expected to drop back to 4.0% in February (from 4.2% in January). The key data point will be the Conference Board’s US Consumer Confidence at 1400GMT which is expected to improve slightly to 132.0 (131.4) which would be a four month high. The Richmond Fed Composite Index for March is at 1400GMT and is expected to drop back to +12 (from +16 in February).
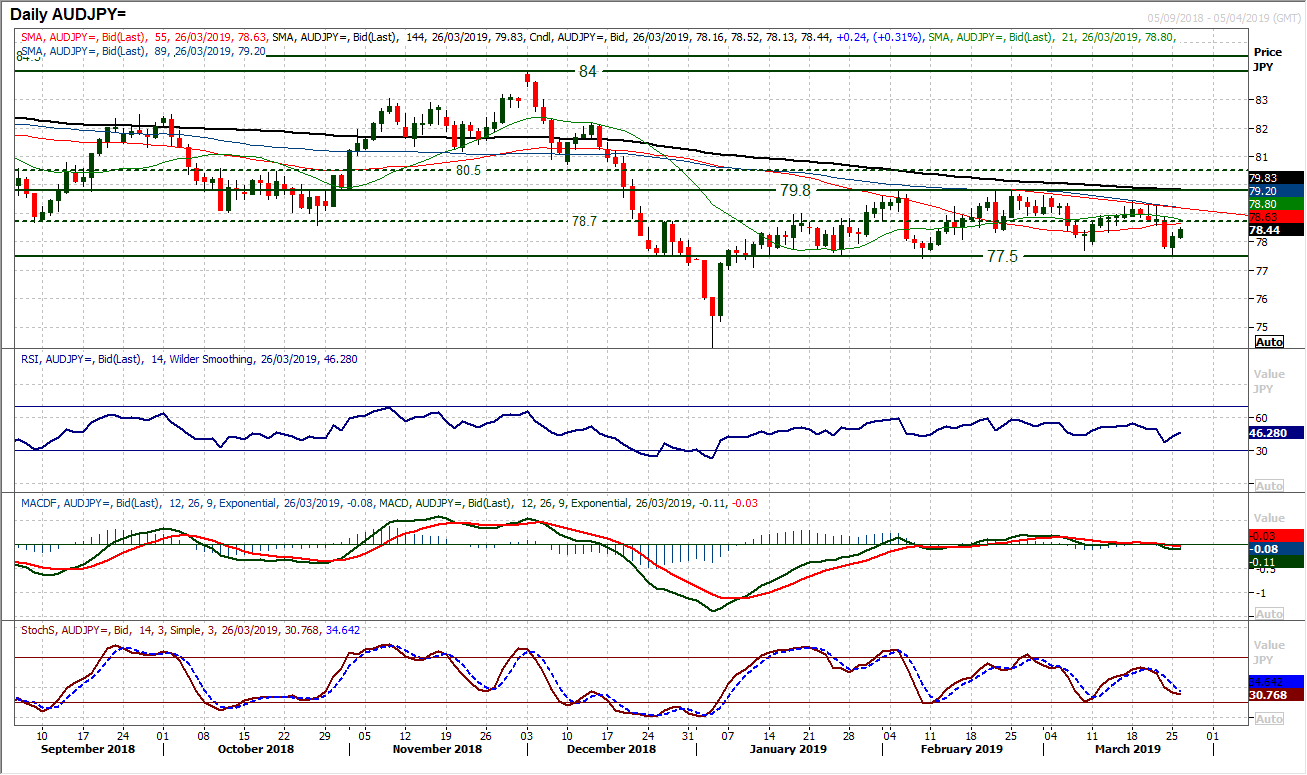
Chart of the Day – AUD/JPY
Once more the range continues. This tight range between 77.50/79.80 has been in place now for ten weeks, however, on a near to medium term basis there is an increasing negative bias within the range which is putting pressure on support. The failure of the rally last week at 79.40 under 79.80 comes with a deterioration in the outlook on momentum signals. The market may have bounced from 77.50 (the range low) yesterday but the RSI fell recently below 40 to a ten week low, whilst the Stochastics are posting sell signals at lower levels (currently in decline). How the market responds now to the pivot line around 78.70 will be interesting, but as the market has rebounded another lower high between 78.70/79.40 would likely be seen as another chance to sell. The market is still positioning for increased pressure on 77.50 again and a close below would be a key outlook changer.
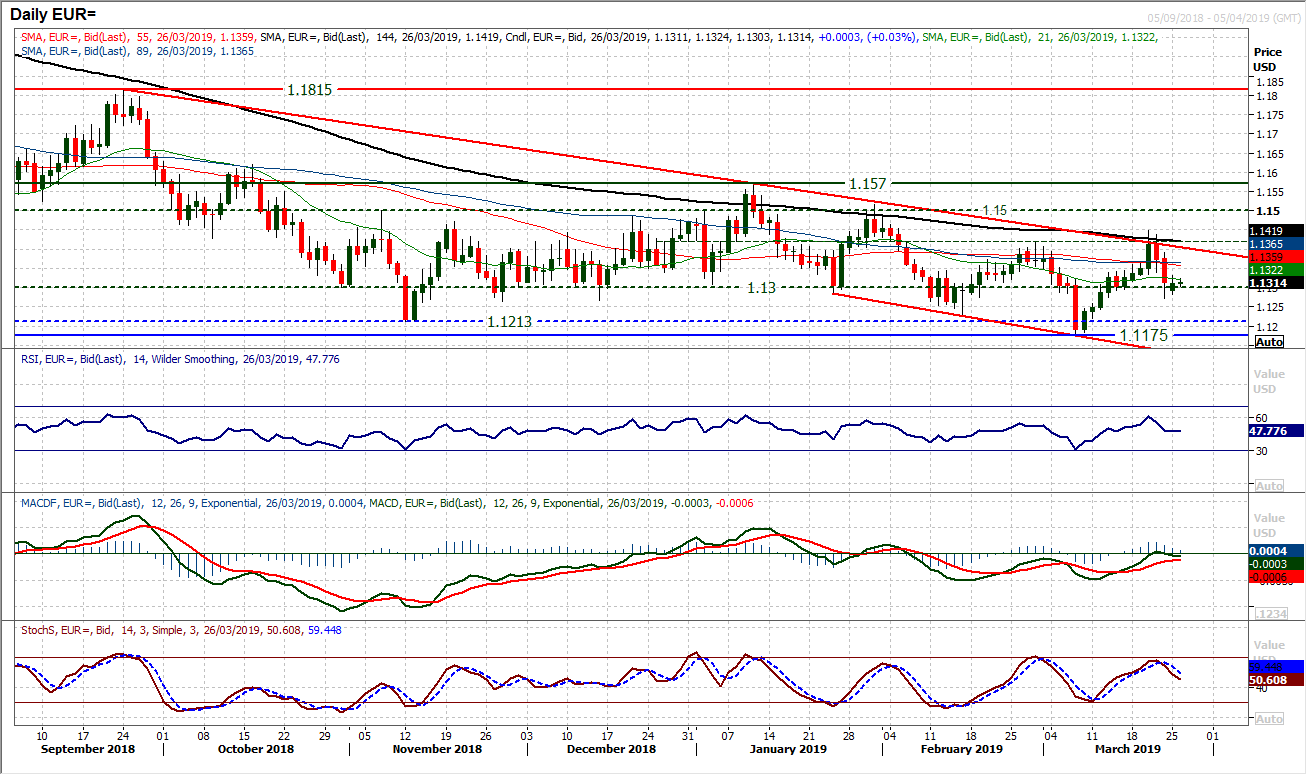
The bulls dusted themselves off yesterday to form a degree of support and pull the market above $1.1300 once more. With a higher daily low on Monday, a positive reaction into the end of the session means that there still has not been a close back under the old key floor of $1.1300. This leaves the market finely poised. Momentum indicators are ticking lower but appear restrained and this looks to be a market now waiting for the next catalyst. On the hourly chart there is near term resistance around $1.1320, being an old pivot. Hourly indicators are just consolidating with the hourly RSI and MACD lines around their neutral points. A move above $1.1350 helps to open upside for the bulls, whilst support at $1.1270 is a basis of a low now.
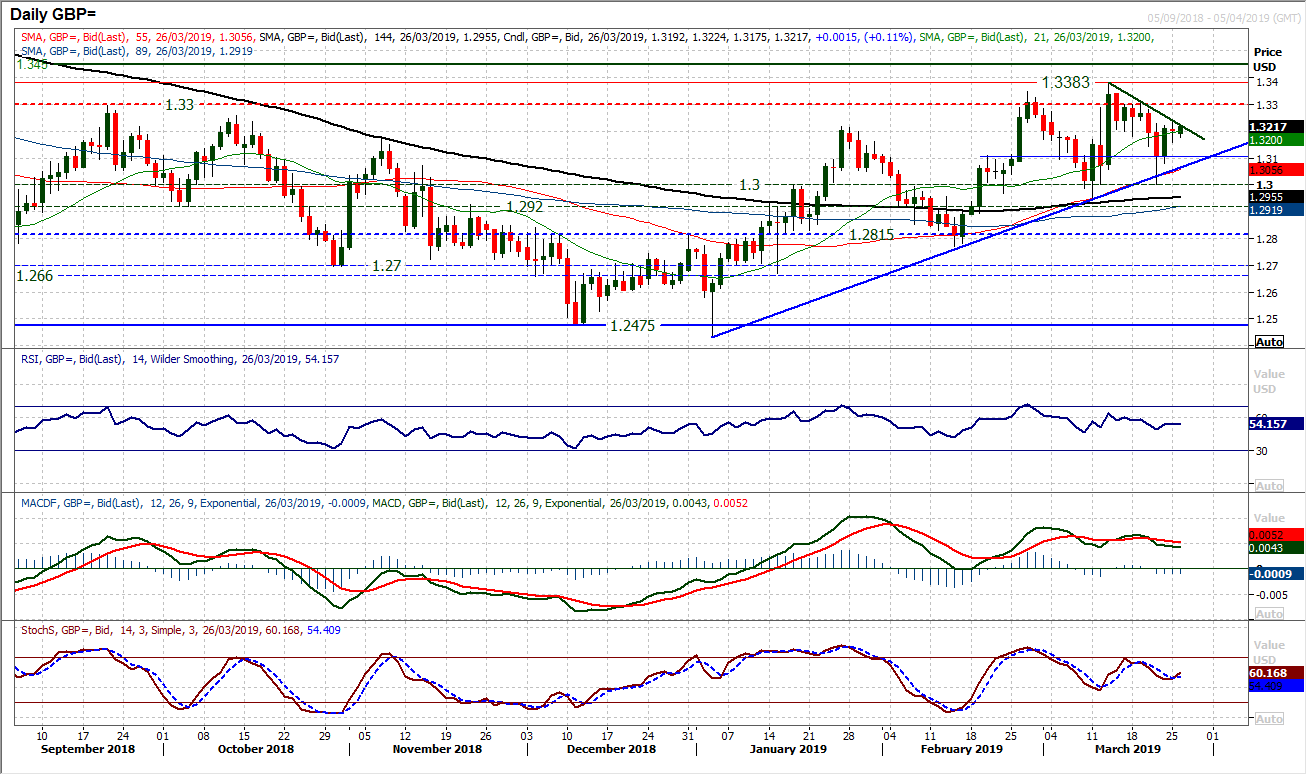
The candlestick on Cable from yesterday’s session sums up Brexit for now, one of uncertain caution. A small real body and daily range of less than 90 pips (Average True Range is currently over 150 pips). Given the medium term uptrend of the past eleven weeks but also the growing downtrend of the past two weeks, there is a sense of consolidation growing. Momentum indicators are stabilising around a rather benign position in a configuration mildly positive over the medium term basis. It is likely this will remain the case until Wednesday evening when the next round of the Brexit gameshow really kicks off. Below $1.3160 initial support opens $1.3100 again, whilst above $1.3250 opens $1.3300. Softer Brexit outcomes remain sterling positive.
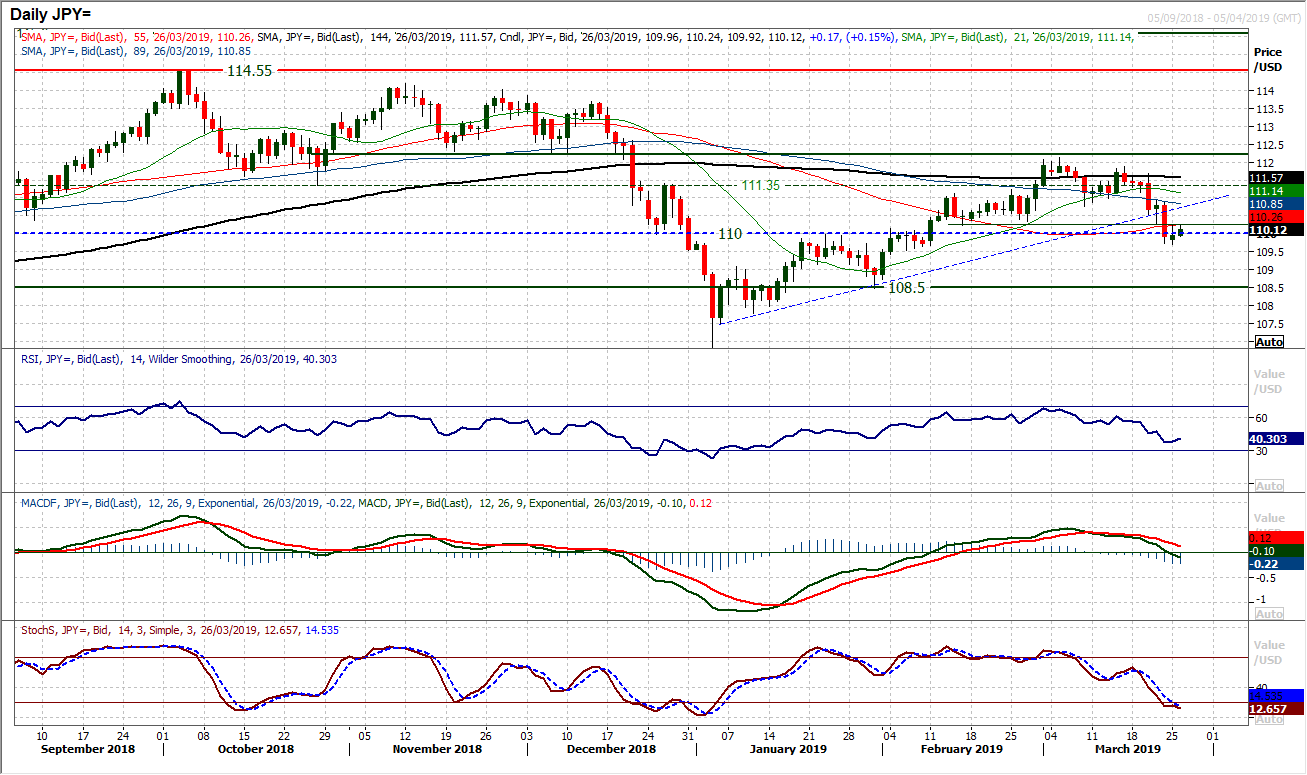
The positive outlook for Dollar/Yen has been damaged to the extent at which the bulls are no longer in control. Last week’s moves changed the game. However, there has been a settling of the selling pressure in the past 24 hours which have seen the bulls just looking to at least stand their ground. How they respond to overhead supply of the resistance built up between 110.25/111.00 is now key. A very mild positive candle was formed yesterday, but looking on the hourly chart this has the look of a consolidation where the market has traded in a 50 pip band 109.75/110.25 which has allowed hourly momentum to unwind. However, a failure of RSI to move decisively above 60 and the MACD lines to move decisively above neutral would question the extent of a recovery. Below the support band 109.55/109.75 opens deeper correction to 108.50 and unless there can be a recovery above 111.00, this is now the risk.
Gold
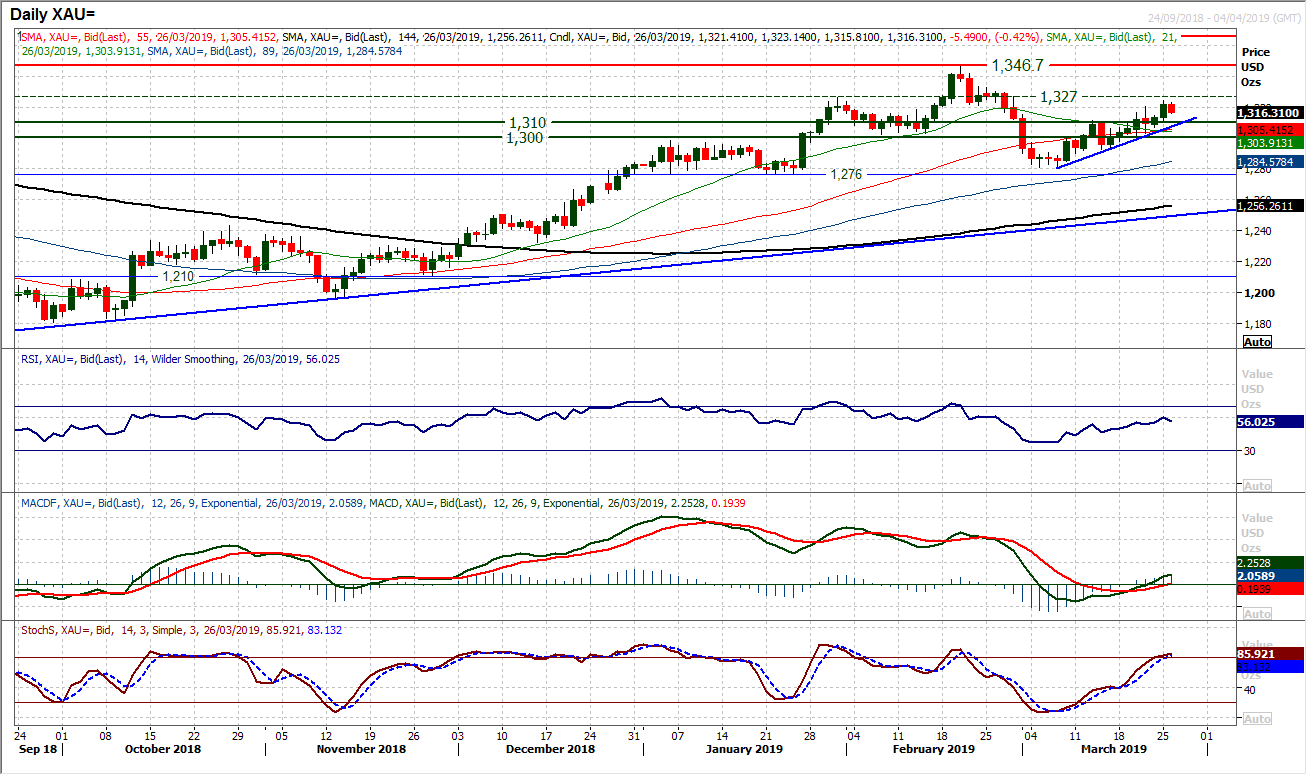
Negative risk appetite has allowed gold to pull higher once more. Trading a whole session above the long term pivot band $1300/$1310 improves the outlook, whilst a close above $1320 has taken the market to a new three week high helps to drive the impetus within the two week uptrend. The move is confirmed with the RSI which closed above 60 yesterday, MACD lines accelerating higher from a bull cross and Stochastics moving above 80. The hourly chart shows the market is now on for a test of the next resistance band $1327/$1333, whilst intraday corrections are a chance to buy. The hourly chart shows a near term breakout support band $1315/$1320 with the pivot at $1310 also supportive. The two week uptrend is at $1307 today and a move below would be a disappointment now.
WTI Oil
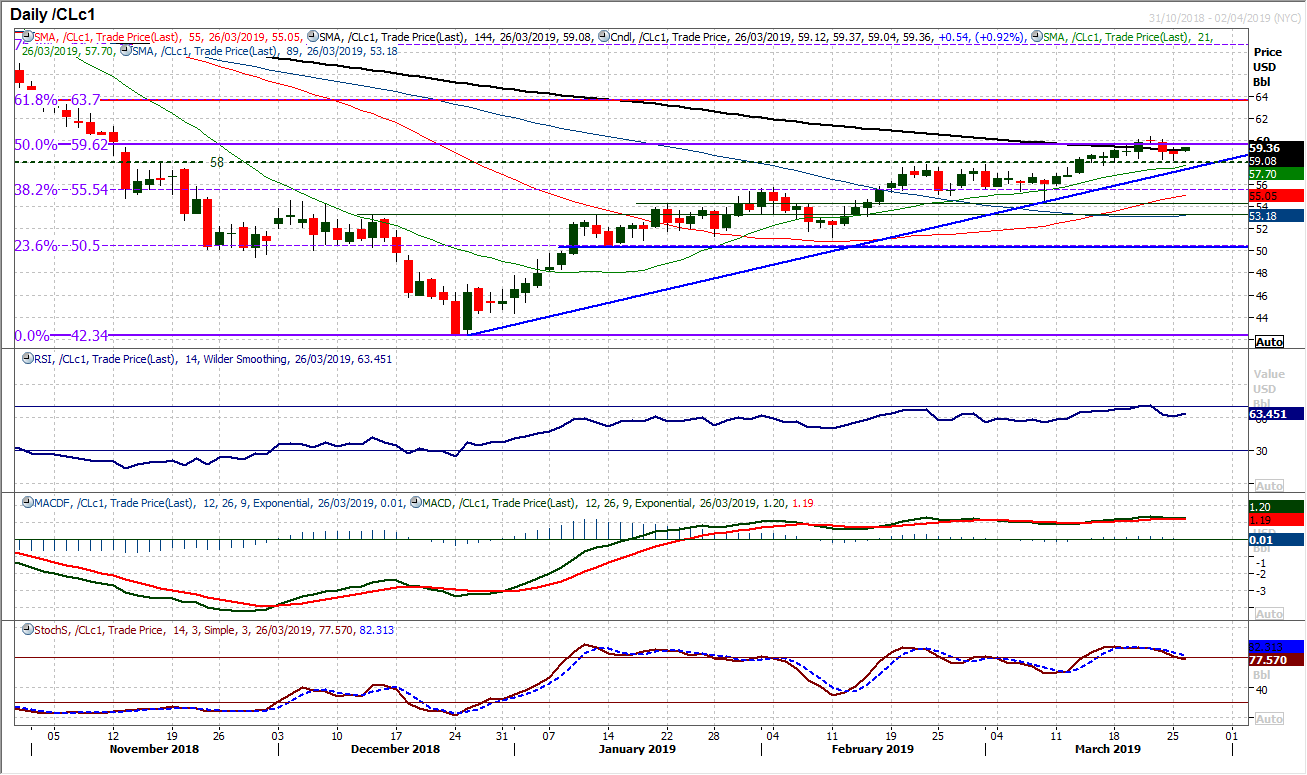
A day of mild correction has allowed nerves to settle as the bulls responded well to the negative implications that have been threatening following Friday’s negative candlestick. The breakout above the $58.00 pivot has left a band of breakout support between $57.50/$58.00 to be used as a buy zone now. With momentum indicators just slipping back in a consolidation phase rather than posting any significant sell signals, there is still an outlook that corrections remain a chance to buy. However, the hourly chart shows that the bulls would not be overly happy on a decisive move below $57.75 which would effectively be a near term top pattern formation. It is therefore also necessary to watch the hourly MACD lines which if they failed around neutral and the hourly RSI failed under 60 then this would be a corrective signal. For now though, the bulls are sitting happily still. Resistance at $59.65/$60.40
Dow Jones Industrial Average
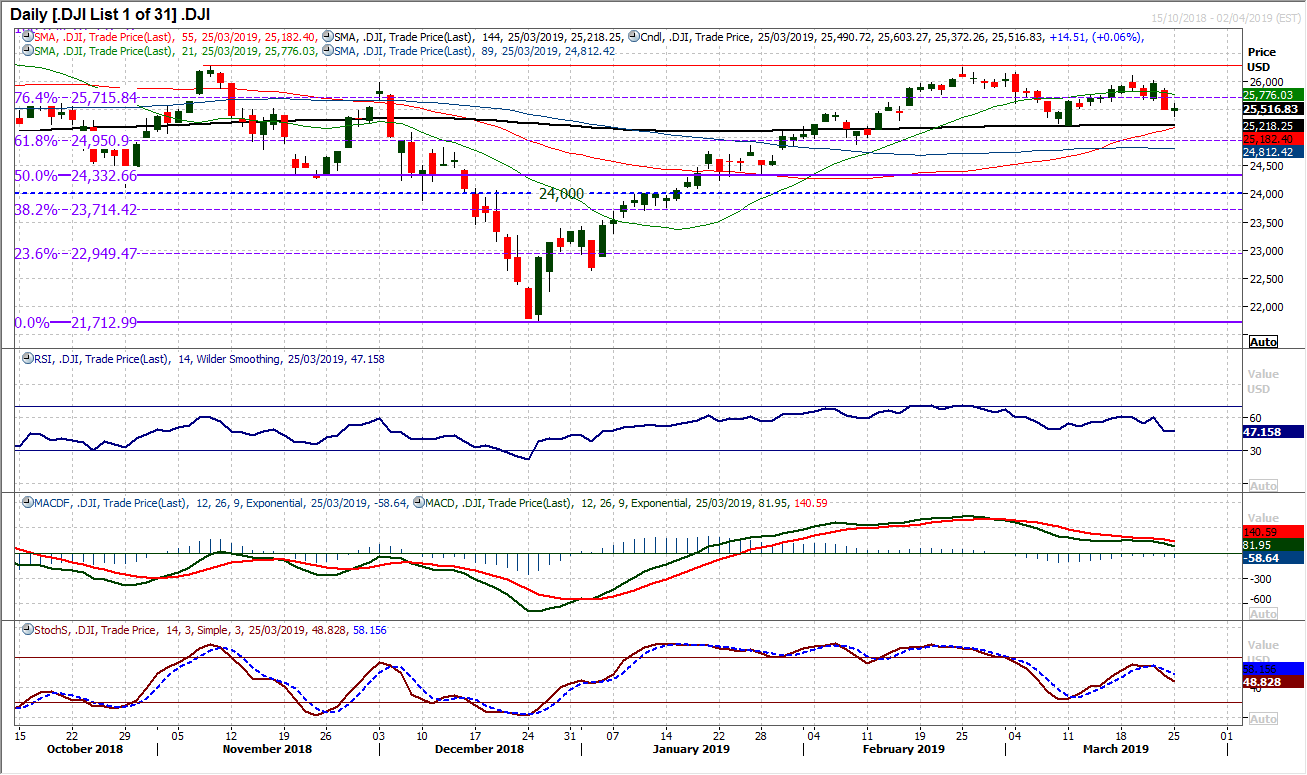
Have the bulls managed to stabilise the selling pressure? In the wake of Friday’s sharp bear candle, early losses could have precipitated lower, but the buyers managed to respond and formed a mild gain on the day. There is still a corrective feel to the market, with the RSI still at 10 week lows under 50, but at least the move has not accelerated lower. The March low at 25,210 remains intact and it will be interesting to see how the bulls respond today. The hourly chart shows a slight improvement in momentum into the close last night and if the bulls can pull above 25,650/25,700 which is a pivot area, then a recovery towards 26,000 can build. A failure of the hourly MACD lines under neutral and RSI under 60 would be a concern now. Initial support 25,370.
Author

Richard Perry
Independent Analyst


