![]() Fawad Razaqzada
Fawad Razaqzada
TradingCandles.com

There is still no end in sight in the rally on Wall Street. The major US indices have hit new 2016 highs today, with financials leading the charge. Sentiment has been boosted by several factors lately. For a start, oil prices have recovered noticeably in recent weeks with a barrel of Brent crude now costing almost $45 and WTI about $42. The obvious impact of firmer oil prices have been on commodity stocks, which have recovered notably and with good volume. Added to this, central banks globally have turned more dovish. The European Central Bank, for example, expanded its QE stimulus programme last month while the Bank of Japan recently cut interest rates into the negative. In the US, the Federal Reserve has talked down the prospects of an aggressive rate hiking cycle. This has been due to stubbornly soft economic data, as highlighted, for example, by the 0.3% fall in retail sales and a weaker-than-expected 0.1% rise in Consumer Price Index measure of inflation in March.
So, the recent weakness in oil prices haven’t led to a notable increase in consumer spending as had been hoped, while inflation is yet to respond to the now firmer energy prices. As mentioned, the CPI merely rose by 0.1% month-over-month in March, weaker than 0.2% expected. On a year-over-year basis, CPI stood at 0.9% rather than 1.1% expected and still significantly below the Fed’s 2% target. Thus, there is no urgency for the Fed to raise interest rates this month or in June. Low interest rates – or expectations thereof – make the higher-yielding stock markets appear more attractive for investors.
There is also a clear disconnect between stock prices and fundamentals: US earnings are expected to decline for the fourth straight quarter. So far, a handful of companies have published mixed results, with Bank of America reporting an 18% decline in quarterly profit. Another factor supporting the markets is China, where the economic situation is apparently no longer a major concern for the market thanks to a slight improvement in data recently. This week, we saw exports come in significantly better than expected while imports stabilised with a smaller-than-expected decline.
However, things could change very quickly and without warning. On Friday, China will release its first quarter GDP estimate and publish its latest industrial production reading. If these figures buck the trend and disappoint expectations then commodities and stocks could fall on fears about demand from the world’s second largest economy. What’s more, the outcome of Russia an OPEC’s meeting in Doha could result in significantly weaker oil prices if they fail to agree on a production freeze, of if the market decides to sell-off anyway as the news may already be in the price. What’s more, the upcoming US earrings results could disappoint the already low expectations. Finally, the major US stock indices have reached some technically-important levels and appear overbought, so at least a short-term pullback may be due anyway. There are plenty of risks for the bulls to consider, therefore.
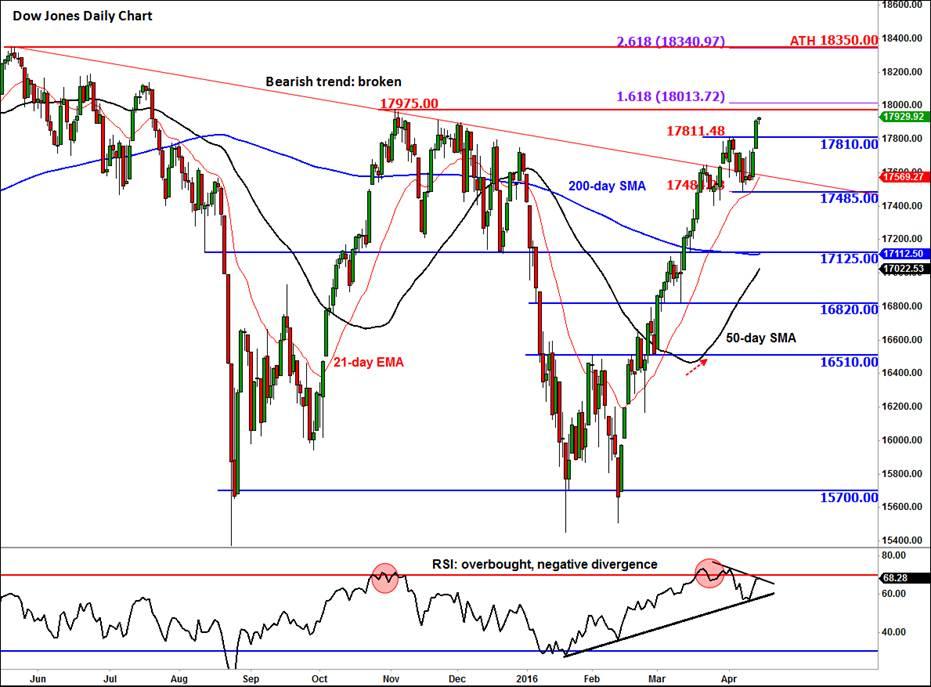
Technical outlook: Dow Jones
But for now, the Dow’s relentless rally continues. As per the daily chart, below, the index is now not too far off its October 2015 high of 17975, having worked off RSI “overbought” conditions through time rather than price action recently (which is bullish). The RSI is again approaching 70 and is currently in a state of negative divergence as the index hits new highs. This is a warning sign for bullish speculators trying to chase the market at these elevated levels. The RSI divergence in itself is not necessarily a bearish signal, but if it gets confirmed by a reversal-looking price candlestick formation then that would be something the bulls will need to be really concerned about. For now, they should proceed with extra care. The bears may wish to wait for their opportunity to pounce after some sort of confirmation.
As mentioned, the next reference point for the Dow is the October 2015 high at 17975. Above this level is the 161.8% Fibonacci extension level of the most recent pullback at 18010/15 area. These areas could well be the supply zone, where profit-takers may step in to bank profit on their long positions. The next potential resistance or bullish target is the all-time high at around 18350 which also corresponds with the 261.8% Fibonacci extension level.
As things stand, the technical outlook would only turn bearish on the Dow if the index breaks below previous resistance, now support, at 17810. Things could then turn really ugly if the next line of defence at 17485 breaks, too. Until and unless that happens, the bulls remain firmly in control.
Trading leveraged products such as FX, CFDs and Spread Bets carry a high level of risk which means you could lose your capital and is therefore not suitable for all investors. All of this website’s contents and information provided by Fawad Razaqzada elsewhere, such as on telegram and other social channels, including news, opinions, market analyses, trade ideas, trade signals or other information are solely provided as general market commentary and do not constitute a recommendation or investment advice. Please ensure you fully understand the risks involved by reading our disclaimer, terms and policies.
Recommended Content
Editors’ Picks
AUD/USD regains the constructive outlook above the 200-day SMA

AUD/USD advanced strongly for the second session in a row, this time extending the recovery to the upper 0.6500s and shifting its focus to the weekly highs in the 0.6580-0.6585 band, an area coincident with the 100-day SMA.
EUR/USD keeps the bullish performance above 1.0700

The continuation of the sell-off in the Greenback in the wake of the FOMC gathering helped EUR/USD extend its bounce off Wednesday’s lows near 1.0650, advancing past the 1.0700 hurdle ahead of the crucial release of US NFP on Friday.
Gold stuck around $2,300 as market players lack directional conviction

Gold extended its daily slide and dropped below $2,290 in the second half of the day on Thursday. The benchmark 10-year US Treasury bond yield erased its daily losses after US data, causing XAU/USD to stretch lower ahead of Friday's US jobs data.
Bitcoin price rises 5% as BlackRock anticipates a new wave of capital inflows into BTC ETFs from investors

Bitcoin (BTC) price slid to the depths of $56,552 on Wednesday as the cryptocurrency market tried to front run the Federal Open Market Committee (FOMC) meeting. The flash crash saw millions in positions get liquidated.
FOMC in the rear-view mirror – NFP eyed

The update from May’s FOMC rate announcement proved more dovish than expected, which naturally weighed on the US dollar (sending the DXY to lows of 105.44) and US yields, as well as, initially at least, underpinning major US equity indices.