![]()
With the EUR/USD rallying to above 1.1300 level today, the USD/CHF is unsurprisingly dropping like a stone. The two currency pairs are inversely-correlated of course because the SNB has more or less pegged its policy to that of the ECB. The Swiss franc is also a safe haven currency and it tends to do better during periods of market turmoil, such as now. Hence, the EUR/CHF has also fallen sharply over the past several days, even if most other euro crosses have rallied as traders unwind their carry trades. The Swissy could be ‘saved’ (temporarily anyway) either by Janet Yellen saying something surprisingly hawkish at her two-day testimony, which starts tomorrow, or if investor sentiment improves suddenly. Neither looks likely.
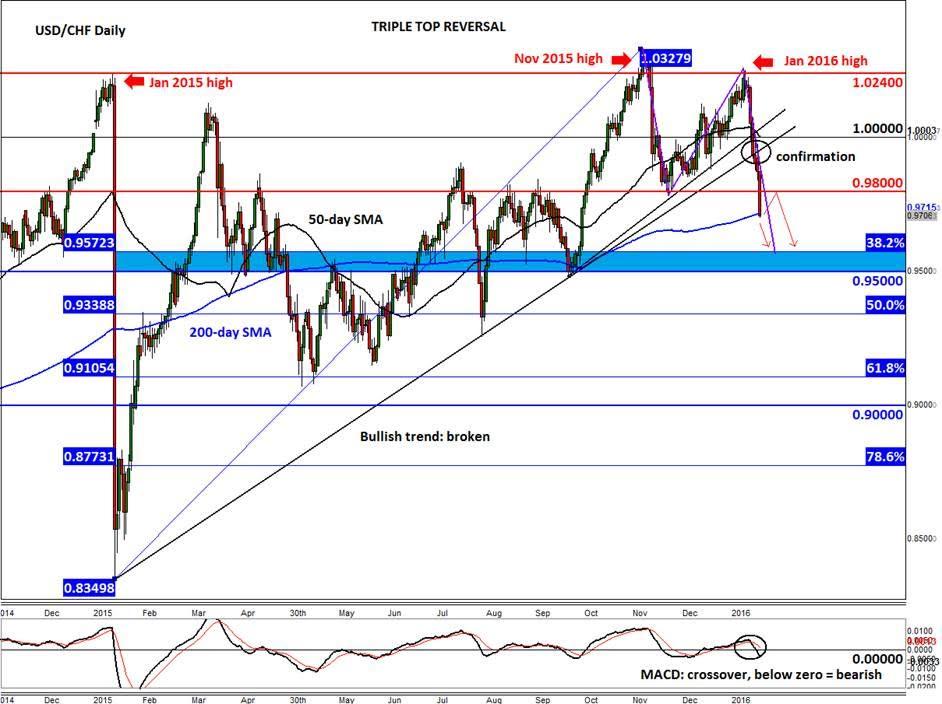
But the chart of the USD/CHF suggests the Swissy may have made a major turning point over the past few months. It has twice failed to break decisively above the January 2015 high: once in November 2015 and again in January this year. In other words, a triple top reversal pattern has been formed. As this is a major reversal formation, the selling pressure could gather pace as more support levels break down, which is now likely.
In fact, the reversal has already seen the Swissy break two bullish trend lines, more or less confirming that the trend has changed. Today, it has also taken out key support in the 0.9785/9800 area too, before dropping to test its 200-moving average at 0.9715. As the short-term charts now suggest price may have dropped too far too fast, rates could bounce back a touch on profit-taking. But essentially the path of least resistance is to the downside and the broken support at 0.9785/9800 is highly likely to cap any potential rallies.
If the 200-day moving average fails to offer much support, then there are not a lot of further reference points to watch until the next potential support and psychological level of 0.9500. It is also worth keeping an eye on the Fibonacci levels of the most recent rally, with the 38.2% retracement coming in around the 0.9570/5 area and 61.8% retracement at 0.9105. The 50% retracement level (not a Fibonacci level) comes in at 0.9335/40.
If however the USD/CHF breaks back above the aforementioned 0.9785/9800 range, then this could pave the way for a rally towards, if not beyond, parity, although that being said, the backside of the broken trend line may prevent price from getting that far.

Trading leveraged products such as FX, CFDs and Spread Bets carry a high level of risk which means you could lose your capital and is therefore not suitable for all investors. All of this website’s contents and information provided by Fawad Razaqzada elsewhere, such as on telegram and other social channels, including news, opinions, market analyses, trade ideas, trade signals or other information are solely provided as general market commentary and do not constitute a recommendation or investment advice. Please ensure you fully understand the risks involved by reading our disclaimer, terms and policies.
Recommended Content
Editors’ Picks
AUD/USD regains the constructive outlook above the 200-day SMA

AUD/USD advanced strongly for the second session in a row, this time extending the recovery to the upper 0.6500s and shifting its focus to the weekly highs in the 0.6580-0.6585 band, an area coincident with the 100-day SMA.
EUR/USD keeps the bullish performance above 1.0700

The continuation of the sell-off in the Greenback in the wake of the FOMC gathering helped EUR/USD extend its bounce off Wednesday’s lows near 1.0650, advancing past the 1.0700 hurdle ahead of the crucial release of US NFP on Friday.
Gold stuck around $2,300 as market players lack directional conviction

Gold extended its daily slide and dropped below $2,290 in the second half of the day on Thursday. The benchmark 10-year US Treasury bond yield erased its daily losses after US data, causing XAU/USD to stretch lower ahead of Friday's US jobs data.
Bitcoin price rises 5% as BlackRock anticipates a new wave of capital inflows into BTC ETFs from investors

Bitcoin (BTC) price slid to the depths of $56,552 on Wednesday as the cryptocurrency market tried to front run the Federal Open Market Committee (FOMC) meeting. The flash crash saw millions in positions get liquidated.
FOMC in the rear-view mirror – NFP eyed

The update from May’s FOMC rate announcement proved more dovish than expected, which naturally weighed on the US dollar (sending the DXY to lows of 105.44) and US yields, as well as, initially at least, underpinning major US equity indices.