![]()
So, the ‘FOMC day’ has come to pass and the rate hiking cycle has begun, as had been widely expected. It looks like the majority of the market participants have interpreted the Fed’s forward guidance as more hawkish than expected – hence the dollar has rallied, if only moderately so far. Remarkably, gold also managed to end Wednesday’s session higher. But was that the bull’s last hurrah? The precious metal had already given up its entire weekly gains by Thursday afternoon, when this report was written.
This time of the year is usually a happy occasion but surely that’s not how the gold bugs must be feeling right now. As we head into the penultimate week of 2015, the remainder of this year’s economic calendar is unsurprisingly populated with more “bank holidays” than macro data. Thus, there is little macro reasons to help change the direction gold is currently heading towards. Trading conditions are likely to be quieter as speculators wind down ahead of the festive period, but long term trends are unlikely to be affected much. If anything, they are most likely to continue, which means we could see firmer dollar and even weaker gold prices over the next few weeks.
Indeed, if the market strongly believes that the Fed will continue to raise rates as per the FOMC’s dot plots, then the dollar may continue pushing a lot higher since most other major central banks are still very dovish. This is not good for assets that are denominated in the dollar, especially gold and silver. Unlike bonds or equities, the metals pay no interest or dividends, and cost money to store. However, if the stock markets start to roll over, say on concerns about the impact of the stronger dollar on future company earnings, then some of the USD’s impact will be neutralised, causing gold to potentially bounce back on safe haven flows. However, inflation is still non-existent for most major economies and until it starts to rise more noticeably gold is unlikely to show major reactions to short term equity market volatility.
The very long term outlook for the metal is still bullish however because of the strong physical demand from central banks and consumers, most notably in India and China. But not many people are currently focusing much on the physical aspects, especially since the paper market (futures and options) is comparatively huge. Thus, for now the short-term outlook remains bearish – and not just from a fundamental point of view.
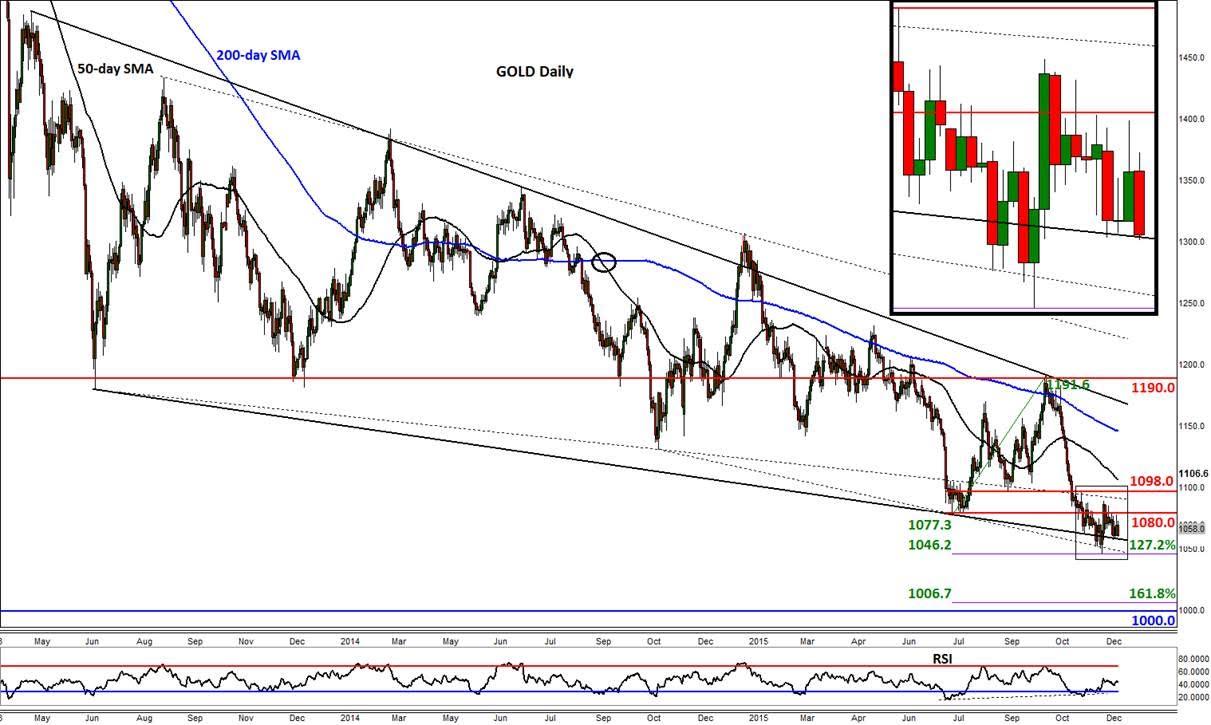
Indeed, from a technical perspective, there are not a lot of bullish indications to be seen when looking at a chart of gold. Granted, the daily RSI may be in a state of positive divergence with price, suggesting that the bearish momentum is weakening, but the start of the Fed’s hiking cycle could lead to renewed selling pressure once more. Gold is currently hovering dangerously around the lower trend of its long-term triangle pattern after it failed to hold conclusively back above the broken support at $1080, which remains a key short-term resistance level. Other near-term resistances include $1098 and the 50-day average at $1106/7. If the aforementioned trend line breaks down, gold may break last month’s low and the 127.2% Fibonacci extension level at $1046, before potentially dropping towards the 161.8% extension level at $1006/7 next. The psychologically-important $1000 handle is thus also in sight now.

Trading leveraged products such as FX, CFDs and Spread Bets carry a high level of risk which means you could lose your capital and is therefore not suitable for all investors. All of this website’s contents and information provided by Fawad Razaqzada elsewhere, such as on telegram and other social channels, including news, opinions, market analyses, trade ideas, trade signals or other information are solely provided as general market commentary and do not constitute a recommendation or investment advice. Please ensure you fully understand the risks involved by reading our disclaimer, terms and policies.
Recommended Content
Editors’ Picks
AUD/USD regains the constructive outlook above the 200-day SMA

AUD/USD advanced strongly for the second session in a row, this time extending the recovery to the upper 0.6500s and shifting its focus to the weekly highs in the 0.6580-0.6585 band, an area coincident with the 100-day SMA.
EUR/USD keeps the bullish performance above 1.0700

The continuation of the sell-off in the Greenback in the wake of the FOMC gathering helped EUR/USD extend its bounce off Wednesday’s lows near 1.0650, advancing past the 1.0700 hurdle ahead of the crucial release of US NFP on Friday.
Gold stuck around $2,300 as market players lack directional conviction

Gold extended its daily slide and dropped below $2,290 in the second half of the day on Thursday. The benchmark 10-year US Treasury bond yield erased its daily losses after US data, causing XAU/USD to stretch lower ahead of Friday's US jobs data.
Bitcoin price rises 5% as BlackRock anticipates a new wave of capital inflows into BTC ETFs from investors

Bitcoin (BTC) price slid to the depths of $56,552 on Wednesday as the cryptocurrency market tried to front run the Federal Open Market Committee (FOMC) meeting. The flash crash saw millions in positions get liquidated.
FOMC in the rear-view mirror – NFP eyed

The update from May’s FOMC rate announcement proved more dovish than expected, which naturally weighed on the US dollar (sending the DXY to lows of 105.44) and US yields, as well as, initially at least, underpinning major US equity indices.