Gold Price Forecast: XAU/USD reconquers $2,400, lacks directional momentum

XAU/USD Current price: $2,404.79
- Key earnings reports and upcoming US first-tier events push investors to the sidelines.
- Treasury yields shed some ground, weighing on the US Dollar.
- XAU/USD bounced back, but additional gains in the near term seem unlikely.
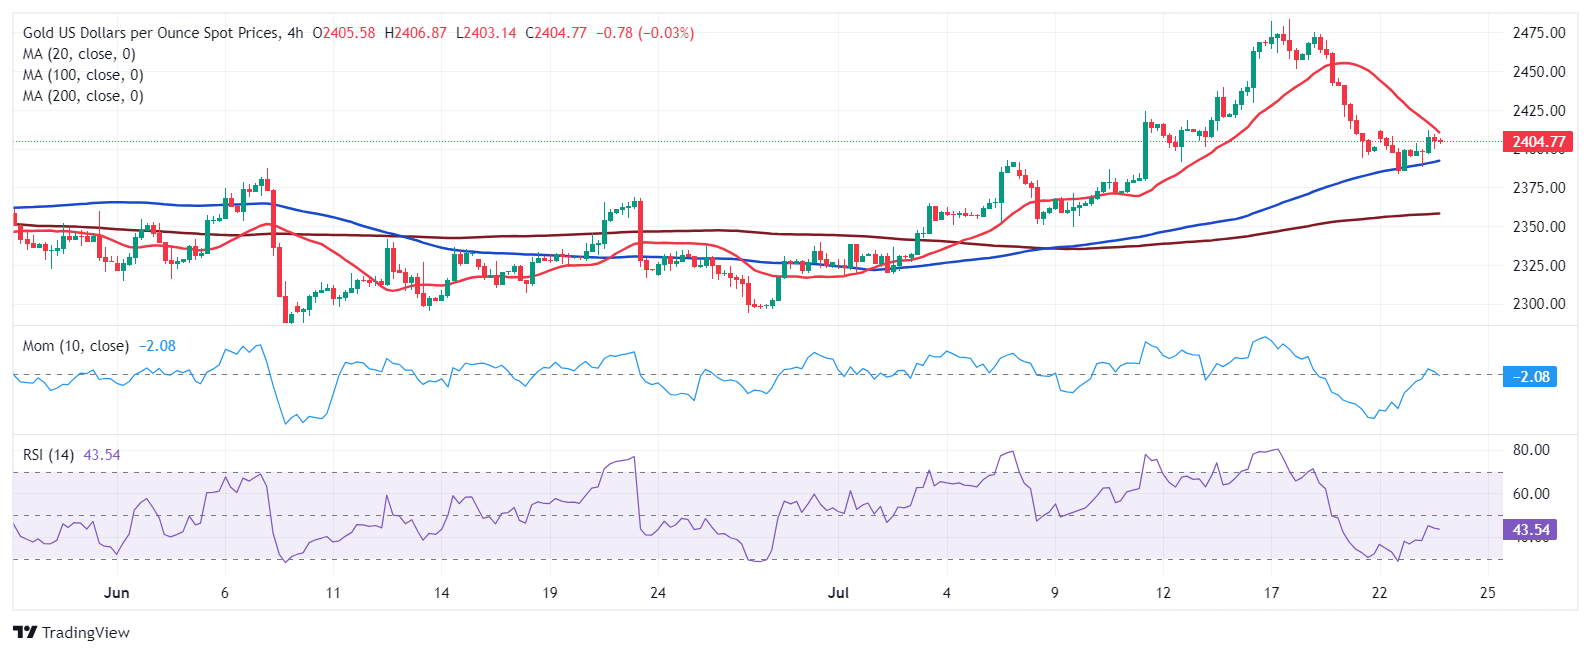
Spot Gold recovered on Tuesday, changing hands at $2,403 a troy ounce. XAU/USD bounced from a weekly low of $2,383.78 posted on Monday as demand for the US Dollar receded ahead of United States (US) first-tier data and key earnings reports. Nevertheless, market participants are increasing their bets that the Federal Reserve (Fed) will deliver a 25 basis point (bps) interest rate cut in September and a similar one in December, also limiting the USD bullish potential.
Finally, easing government bond yields undermines demand for the Greenback. The 10-year Treasury note currently offers 4.23%, while the 2-year note yields 4.49%, down roughly 3 bps each.
A scarce macroeconomic calendar and upcoming US first-tier events further exacerbate the lack of clear directional strength. Investors are waiting for the preliminary estimate of the Q2 Gross Domestic Product (GDP) to be out on Friday, alongside revisions for the Personal Consumption Expenditures (PCE) Price Index in the same period, the Fed’s favourite inflation gauge. Furthermore, the country will release the June PCE inflation data on Friday, which will have a lesser impact than usual but will still affect the USD.
XAU/USD short-term technical outlook
The daily chart for the XAU/USD pair shows it is bouncing from the 50% Fibonacci retracement of the $2,293.54/$2,483.68 rally at $2,389.30. At the same time, a bullish 20 Simple Moving Average (SMA) heads higher just below the mentioned Fibonacci level, while the longer ones also advance below the longer ones, in line with the dominant bullish trend. Finally, the Momentum indicator maintains its downward slope within positive levels, while the Relative Strength Index (RSI) has turned marginally higher at around 54, supporting another leg higher.
In the near term, and according to the 4-hour chart, an upward extension seems limited. XAU/USD topped around the 38.2% retracement of the mentioned rally, providing statict resistance at $2,411.25. Furthermore, a bearish 20 SMA converges with the Fibonacci level, reinforcing it. Meanwhile, the Momentum indicator aims north at around its 100 line, while the RSI indicator remains directionless at 42.
Support levels: 2,389.30 2,377.10 2,364.00
Resistance levels: 2,411.25 2,425.70 2,439.90
Author

Valeria Bednarik
FXStreet
Valeria Bednarik was born and lives in Buenos Aires, Argentina. Her passion for math and numbers pushed her into studying economics in her younger years.