XAU/USD Current price: $2,514.13
- Upcoming first-tier events in the United States and central banks’ announcements spur caution.
- US Treasury yields touched fresh one-year lows and aim to extend their slides.
- XAU/USD consolidates gains above $2,500 with a neutral technical stance.
Gold extended its recovery on Tuesday, trading around $2,513 a troy ounce mid-US session. Financial markets turned risk-averse ahead of first-tier events, resulting in a firmer US Dollar against major rivals except for safe-haven ones. Gold, the Swiss Franc and the Japanese Yen post modest advances vs the American currency as Wall Street dipped.
There has not been a specific catalyst for the souring mood, but caution ahead of the release of the United States (US) Consumer Price Index (CPI) on Wednesday and the European Central Bank (ECB) monetary policy decision on Thursday. About the first, market players are expecting easing price pressures, yet inflation holds above the Federal Reserve (Fed) goal of around 2%. Nevertheless, the Fed is scheduled to announce its decision on monetary policy next week and most likely trim interest rates by 25 basis points (bps).
Meanwhile, US Treasury yields retreat. The 10-year note offers 3.66% after bottoming at 3.64%, a fresh 52-week low. The same happens with the 2-year note, now yielding 3.62% after bottoming at 3.59%.
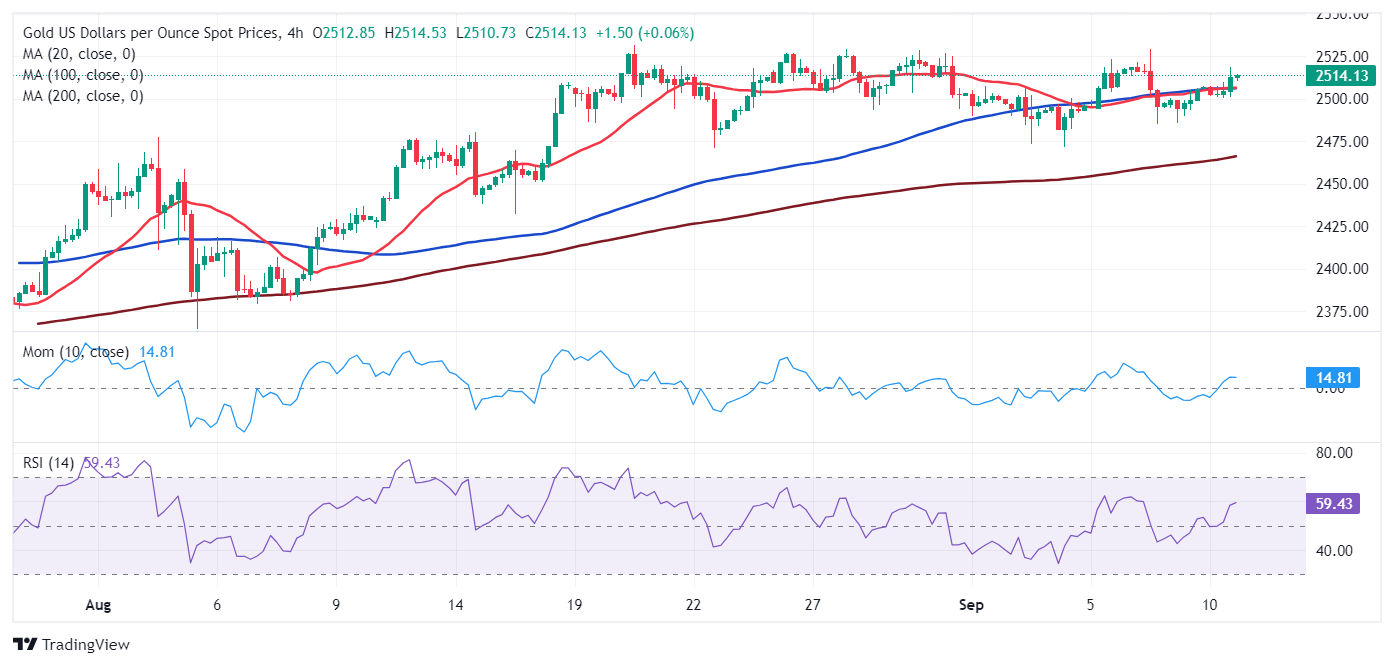
XAU/USD short-term technical outlook
The daily chart for XAU/USD offers a neutral-to-bullish stance, with the pair still meeting intraday buyers around a bullish 20 Simple Moving Average (SMA). Technical indicators, in the meantime, lack directional strength, with the Momentum indicator stuck around its 100 line and the Relative Strength Index (RSI) indicator consolidating at around 58. Finally, the 100 and 200 SMAs keep grinding higher, far below the current level, limiting the bearish potential in the wider perspective.
For the near term, the 4-hour chart offers a neutral stance. XAU/USD trades above its 20 and 100 SMAs, while the 200 SMA advances far below the current level. Technical indicators have turned flat, reflecting the absence of directional conviction, although the fact that the RSI indicator stands at 56 suggests bears have no interest in Gold.
Support levels: 2,507.60 2,489.60 2,475.70
Resistance levels: 2,519.75 2,531.60 2,545.00
Information on these pages contains forward-looking statements that involve risks and uncertainties. Markets and instruments profiled on this page are for informational purposes only and should not in any way come across as a recommendation to buy or sell in these assets. You should do your own thorough research before making any investment decisions. FXStreet does not in any way guarantee that this information is free from mistakes, errors, or material misstatements. It also does not guarantee that this information is of a timely nature. Investing in Open Markets involves a great deal of risk, including the loss of all or a portion of your investment, as well as emotional distress. All risks, losses and costs associated with investing, including total loss of principal, are your responsibility. The views and opinions expressed in this article are those of the authors and do not necessarily reflect the official policy or position of FXStreet nor its advertisers. The author will not be held responsible for information that is found at the end of links posted on this page.
If not otherwise explicitly mentioned in the body of the article, at the time of writing, the author has no position in any stock mentioned in this article and no business relationship with any company mentioned. The author has not received compensation for writing this article, other than from FXStreet.
FXStreet and the author do not provide personalized recommendations. The author makes no representations as to the accuracy, completeness, or suitability of this information. FXStreet and the author will not be liable for any errors, omissions or any losses, injuries or damages arising from this information and its display or use. Errors and omissions excepted.
The author and FXStreet are not registered investment advisors and nothing in this article is intended to be investment advice.
Recommended Content
Editors’ Picks

EUR/USD stabilizes above 1.1350 on Easter Friday
EUR/USD enters a consolidation phase above 1.1350 on Friday as the trading action remains subdued, with major markets remaining closed in observance of the Easter Holiday. On Thursday, the European Central Bank (ECB) announced it cut key rates by 25 bps, as expected.

GBP/USD fluctuates below 1.3300, looks to post weekly gains
After setting a new multi-month high near 1.3300 earlier in the week, GBP/USD trades in a narrow band at around 1.32700 on Friday and remains on track to end the week in positive territory. Markets turn quiet on Friday as trading conditions thin out on Easter Holiday.

Gold ends week with impressive gains above $3,300
Gold retreated slightly from the all-time high it touched at $3,357 early Thursday but still gained more than 2% for the week after settling at $3,327. The uncertainty surrounding US-China trade relations caused markets to adopt a cautious stance, boosting safe-haven demand for Gold.

How SEC-Ripple case and ETF prospects could shape XRP’s future
Ripple consolidated above the pivotal $2.00 level while trading at $2.05 at the time of writing on Friday, reflecting neutral sentiment across the crypto market.

Future-proofing portfolios: A playbook for tariff and recession risks
It does seem like we will be talking tariffs for a while. And if tariffs stay — in some shape or form — even after negotiations, we’ll likely be talking about recession too. Higher input costs, persistent inflation, and tighter monetary policy are already weighing on global growth.

The Best brokers to trade EUR/USD
SPONSORED Discover the top brokers for trading EUR/USD in 2025. Our list features brokers with competitive spreads, fast execution, and powerful platforms. Whether you're a beginner or an expert, find the right partner to navigate the dynamic Forex market.