Gold Price Forecast: XAU/USD grinds north above $2,620

XAU/USD Current price: $2,621.68
- United States employment figures revive concerns about the sector’s health.
- Wall Street opened mixed, with only the S&P500 trading in the green.
- XAU/USD’s near-term picture shows buyers continue to hesitate.
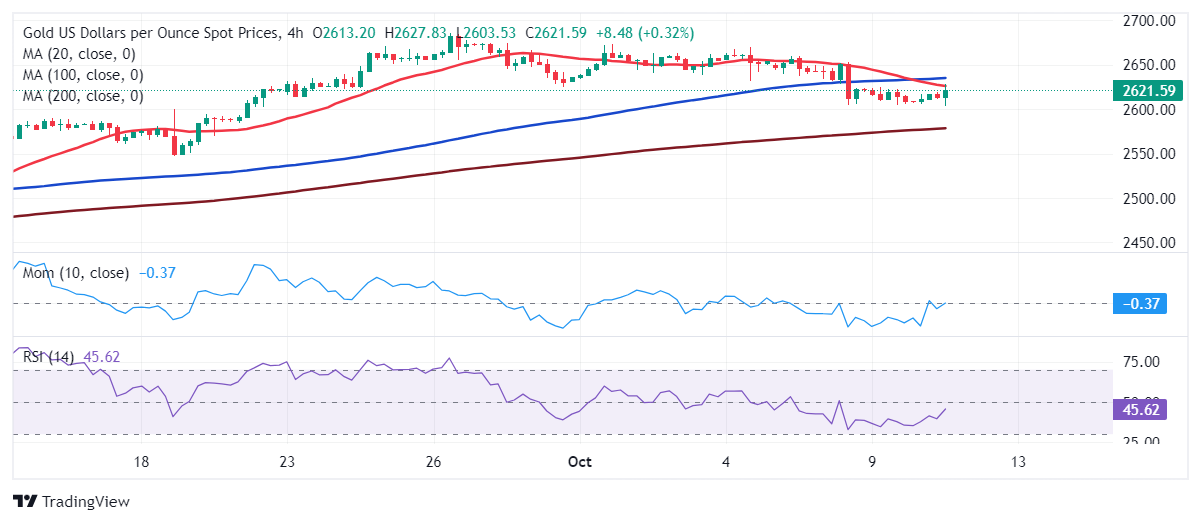
Gold price bounced sharply after nearing the $2,600 mark, now trading around the $2,620 level. The US Dollar saw a short-lived spike following the release of United States (US) data, which came opposite to the Federal Reserve (Fed) needs.
On the one hand, inflation in September was hotter than anticipated. The annual Consumer Price Index (CPI) rose by 2.4%, easing from the previous 2.5% but higher than the 2.3% expected. Core annual CPI rose 3.3%, above the August reading and the market forecast of 3.2%. On a monthly basis, the CPI was up 0.2% against the 0.1% anticipated by market participants. On the other hand, Initial Jobless Claims for the week ended October 4 rose to 258K, worse than the 230K expected.
After the dust settled, however, market participants understood the figures were hardly enough to affect future Federal Reserve’s (Fed) decisions. The US Dollar seesawed between gains and losses but seems to be slowly recovering its bullish poise. American stock markets, in the meantime, struggle for direction. Following the upbeat performance of Asian and European indexes, only the S&P500 posts gains.
Looking ahead, market participants will have to wait for US data scheduled for next week, as well as the European Central Bank (ECB) monetary policy announcement.
XAU/USD short-term technical outlook
From a technical point of view, the daily chart for the XAU/USD pair shows it may soon resume its advance. After falling below a still bullish 20 Simple Moving Average (SMA), Gold aims to recover above it. In the meantime, the 100 and 200 SMAs maintain their bullish slopes far below the current level. Finally, the Momentum indicator hovers around its 100 line, partially losing its bearish strength, while the Relative Strength Index (RSI) indicator turned higher and currently stands at around 55.
The near-term picture is still bearish. XAU/USD is meeting sellers at around its 20 SMA, which extends its slide below a mildly bullish 100 SMA. Technical indicators, in the meantime, offer neutral-to-bearish slopes while developing below their midlines. At this point, a steeper decline below the $2,600 mark seems unlikely, but the odds for a firmer advance in the near term are still low.
Support levels: 2,603.90 2,589.10 2,575.20
Resistance levels: 2,625.40 2,637.10 2,652.90
Author

Valeria Bednarik
FXStreet
Valeria Bednarik was born and lives in Buenos Aires, Argentina. Her passion for math and numbers pushed her into studying economics in her younger years.

















