Gold breaks into fifth super cycle as Dollar collapses below 100: What traders need to know now

After a historic Q1 rally, gold is making new highs while the U.S. dollar breaks below 100. As global markets spiral deeper into uncertainty, investors are flocking to safe havens.
Gold's super cycle: The fifth wave has begun
In our April 2nd, 2025 analysis, we projected a potential pullback in gold following its record 20% gain in Q1 — the metal's best quarterly performance since 1970. That pullback materialised as expected, with prices retracing to $2,936, the midpoint of the two-year bullish channel that began in October 2023. This zone once again served as a strategic re-entry point for both traders and long-term investors.
What followed was historic.
Gold broke out of the two-year price channel, hitting new targets at $3,192 and $3,230, confirming the launch of what now appears to be the fifth cycle in gold's ongoing super price structure highlighted in the previous analysis. This breakout underscores a powerful flight-to-safety trend as investors seek refuge amid persistent market instability, inflation pressures, and mounting concerns of a U.S. recession.
If $3,230 holds, the next upside leg could aim for $3,290 and the super cycle target at $3,328. If a retracement occurs, look for support at $3,192 and $3,158 to hold the structure.
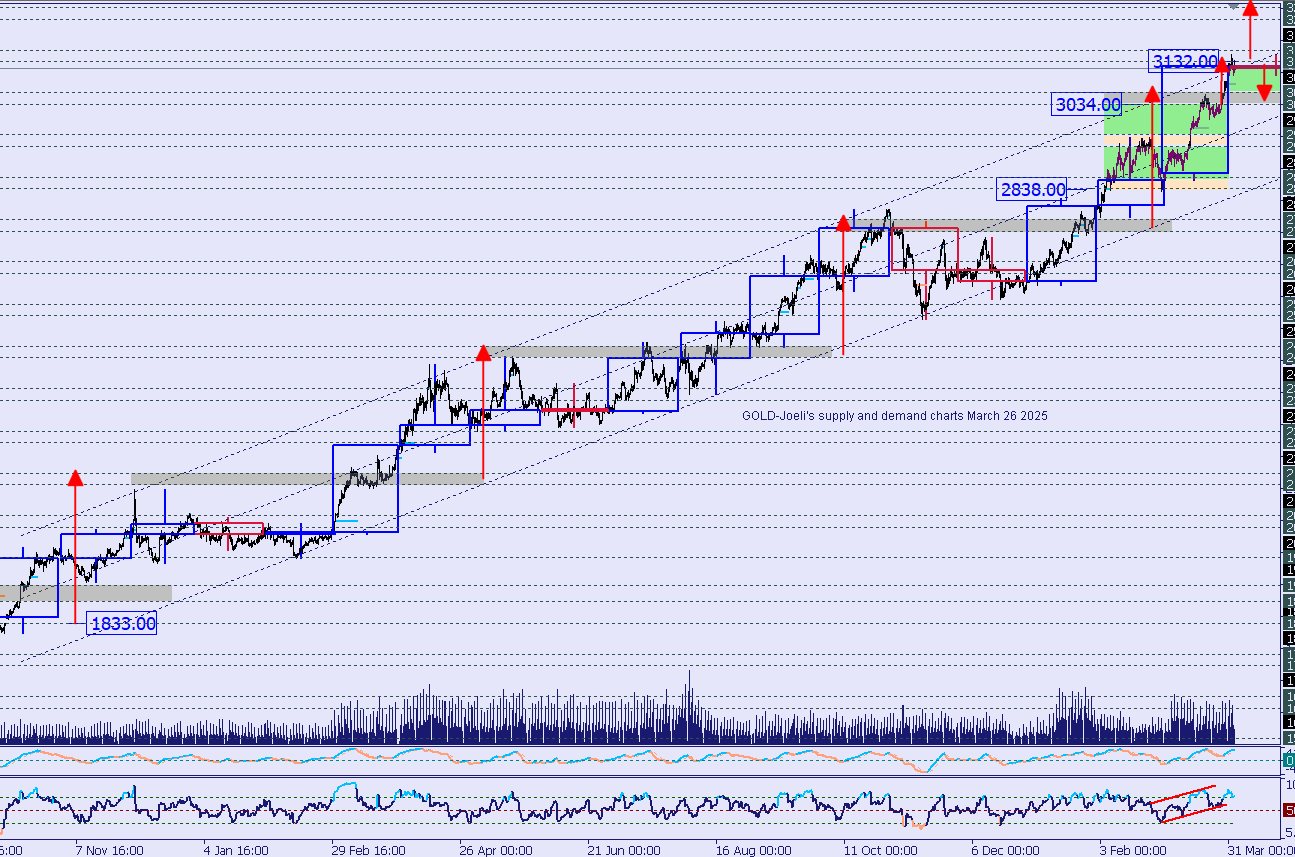
Gold analysis March 25 2025
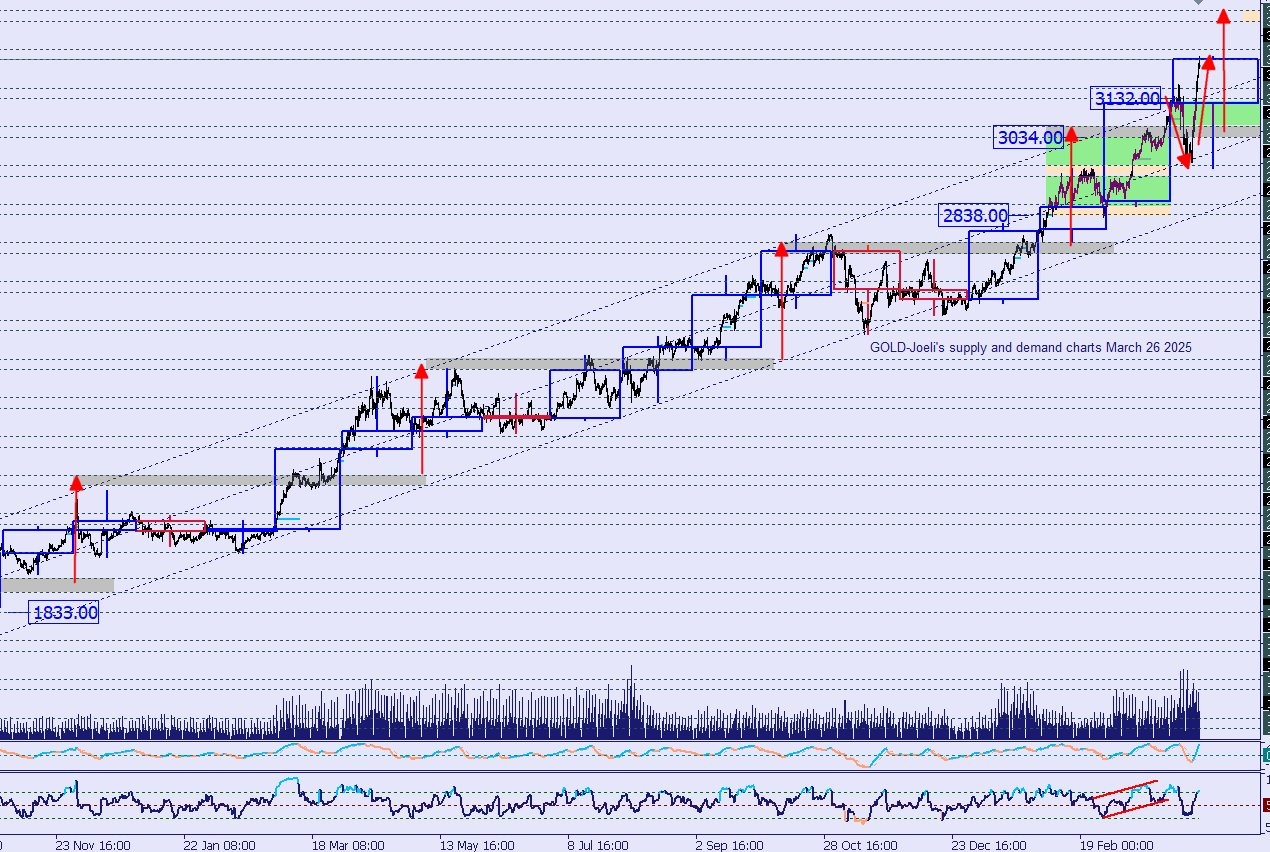
Gold price chart update April 10 2025
The Dollar collapses below 100: A structural breakdown unfolds
While gold climbs, the U.S. Dollar Index (DXY) has entered free fall. After multiple failed attempts to break the 104.00 resistance throughout March, the dollar began its descent, culminating in a clean breakdown below the psychological 100.00 level. As of writing, the DXY trades at 99-54 after hitting an intraday low of 98-82.
This is more than a symbolic move—100.00 was the base of the prior dollar rally from September 2024, which pushed DXY to 110. A breakdown at this level signals a structural shift, which, unless quickly reversed, could deepen into uncharted territory.
-
Support to monitor: 99-27 (pivot zone), 97-60, and 95-70.
-
Resistance overhead: 100.00, 100.46, 100.87, and key resistance at 101.20.
The dollar's weakness is driven by a sharp drop in rate expectations, rising recession probability, and the surge in central bank gold purchases, particularly from emerging economies hedging against dollar exposure.
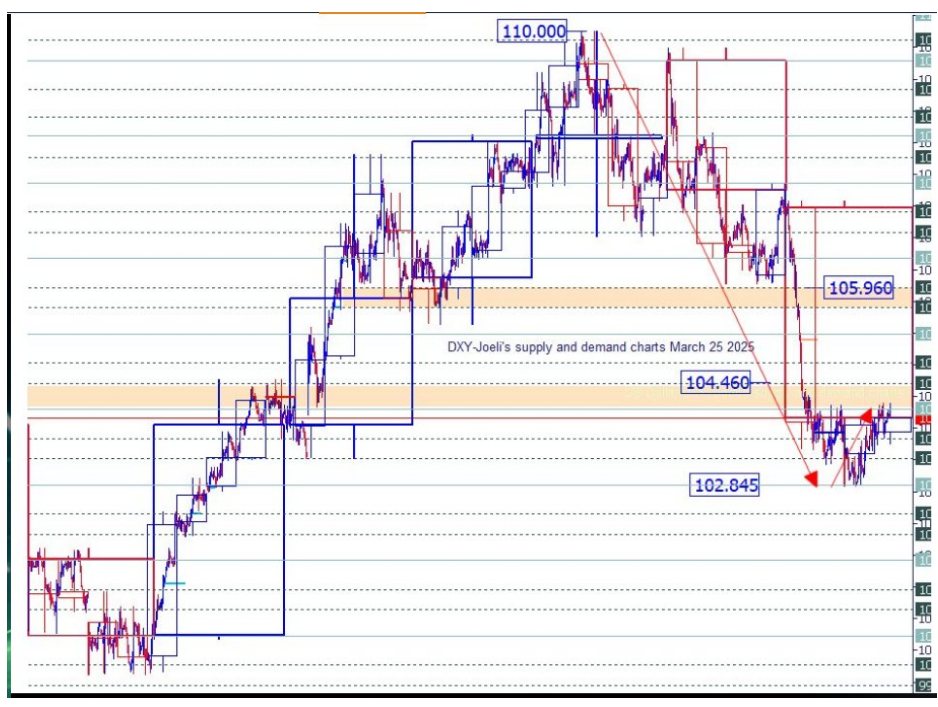
DXY chart analysis March 25 2025
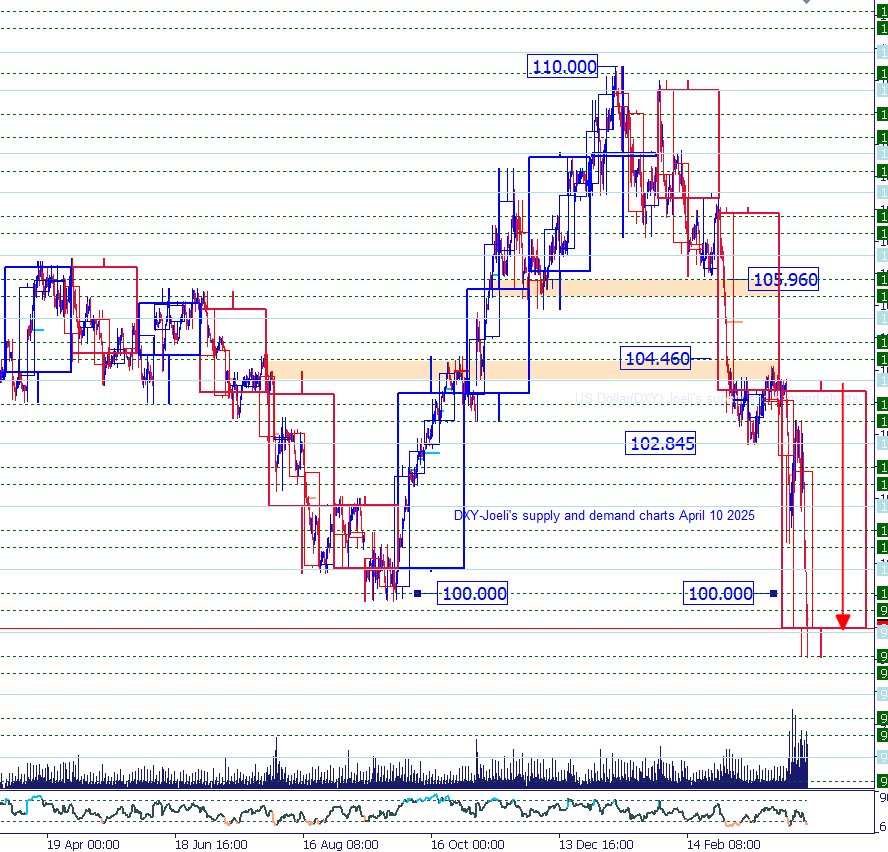
DXY chart update April 10 2025
Why the tariff war is backfiring on the Dollar
As trade tensions escalate in 2025, many expected the U.S. dollar to behave as it traditionally has during global uncertainty — as a safe haven. But the dollar's behaviour has been anything but defensive. The DXY has been down more than 4% since March, and the drop below 100 marks a deeper structural concern. Here's why the tariff war may be doing more harm than good for the greenback:
1. Tariffs Are Inflationary, Not Growth Positive.
Tariffs on imports from China, the EU, and North America have raised production costs and fueled inflation, particularly in consumer goods. With the Fed on pause, inflation is going unchecked, eroding real yield advantage and weakening dollar appeal.
2. Retaliation Risks Hurt U.S. Trade and Growth.
Tariff retaliation has created an environment of muted global demand. With U.S. exports under pressure and earnings expectations declining, the economic outlook is softening—placing long-term downside pressure on the dollar.
3. The Dollar's Safe-Haven Status Is Diminishing
-
Central banks are diversifying away from USD.
-
Political instability and debt concerns are rising.
-
Gold is re-emerging as the dominant global hedge.
Investors are rotating out of paper currencies, including the dollar, in favour of hard assets like gold.
4. Structural Shift Toward Hard Assets.
Persistent inflation and systemic volatility have made non-yielding, inflation-resistant assets more attractive. Gold is rallying while the dollar struggles to hold technical ground. This shift in investor behaviour reflects broader doubts about the dollar's role going forward.
Gold vs. Dollar: A Structural Divergence With Global Implications
This divergence is not just technical — it's macro and structural.
-
Gold is supported by safe-haven demand, central bank purchases, and long-term inflation hedging.
-
The dollar is suffering from failed recoveries, weaker data, and a loss of global confidence due to domestic political and fiscal uncertainty.
Until the DXY can reclaim 100.00 and hold above key resistance zones, gold will likely continue to be bought aggressively on pullbacks.
Key levels to watch
Gold (XAU/USD):
-
Immediate support: $3,192, $3,158.
-
Resistance targets: $3,290, $3,328.
US Dollar Index (DXY):
-
Key support: 99-27, 97-60, 95-70.
-
Resistance: 100.00, 100.46, 100.87, 101.20.
What comes next?
The gold market is entering a pivotal moment. If momentum holds above $3,230, the path to $3,328 could unfold quickly. Meanwhile, the dollar must reclaim lost ground or risk deeper structural declines. With inflation lingering, geopolitical tensions rising, and U.S. fiscal policy under scrutiny, the market's preference for hard assets over fiat is growing stronger.
Author

Denis Joeli Fatiaki
Independent Analyst
Denis Joeli Fatiaki possesses over a decade of extensive experience as a multi-asset trader and Market Strategist.
















