BTC/USD tries ending volatile week above 80k on further short covering

Global macro
Risky assets are having varying degrees of success in resuming the short covering rebound efforts that began Monday, with some initial Friday Asia morning progress being unwound for the Nasdaq100 for instance as of the Friday Asia late afternoon (London morning). Nevertheless, those playing what could still be a Dead Cat bounce lasting another several days to weeks (which essentially is a Bear Flag consolidation), should be prepared first for potentially more volatility just before ending a historic week with today’s highly anticipated the US PPI at 830am EST and the US preliminary UoM consumer sentiment and inflation expectations at 10pm EST. Anticipation has dampened for an emergency Fed rate cut ahead of the next Fed meeting in May (and for a rate cut before the June Fed meeting), with medium term inflationary effects from the Trump administration tariffs now expected to keep Powell from cutting before June.
US treasuries
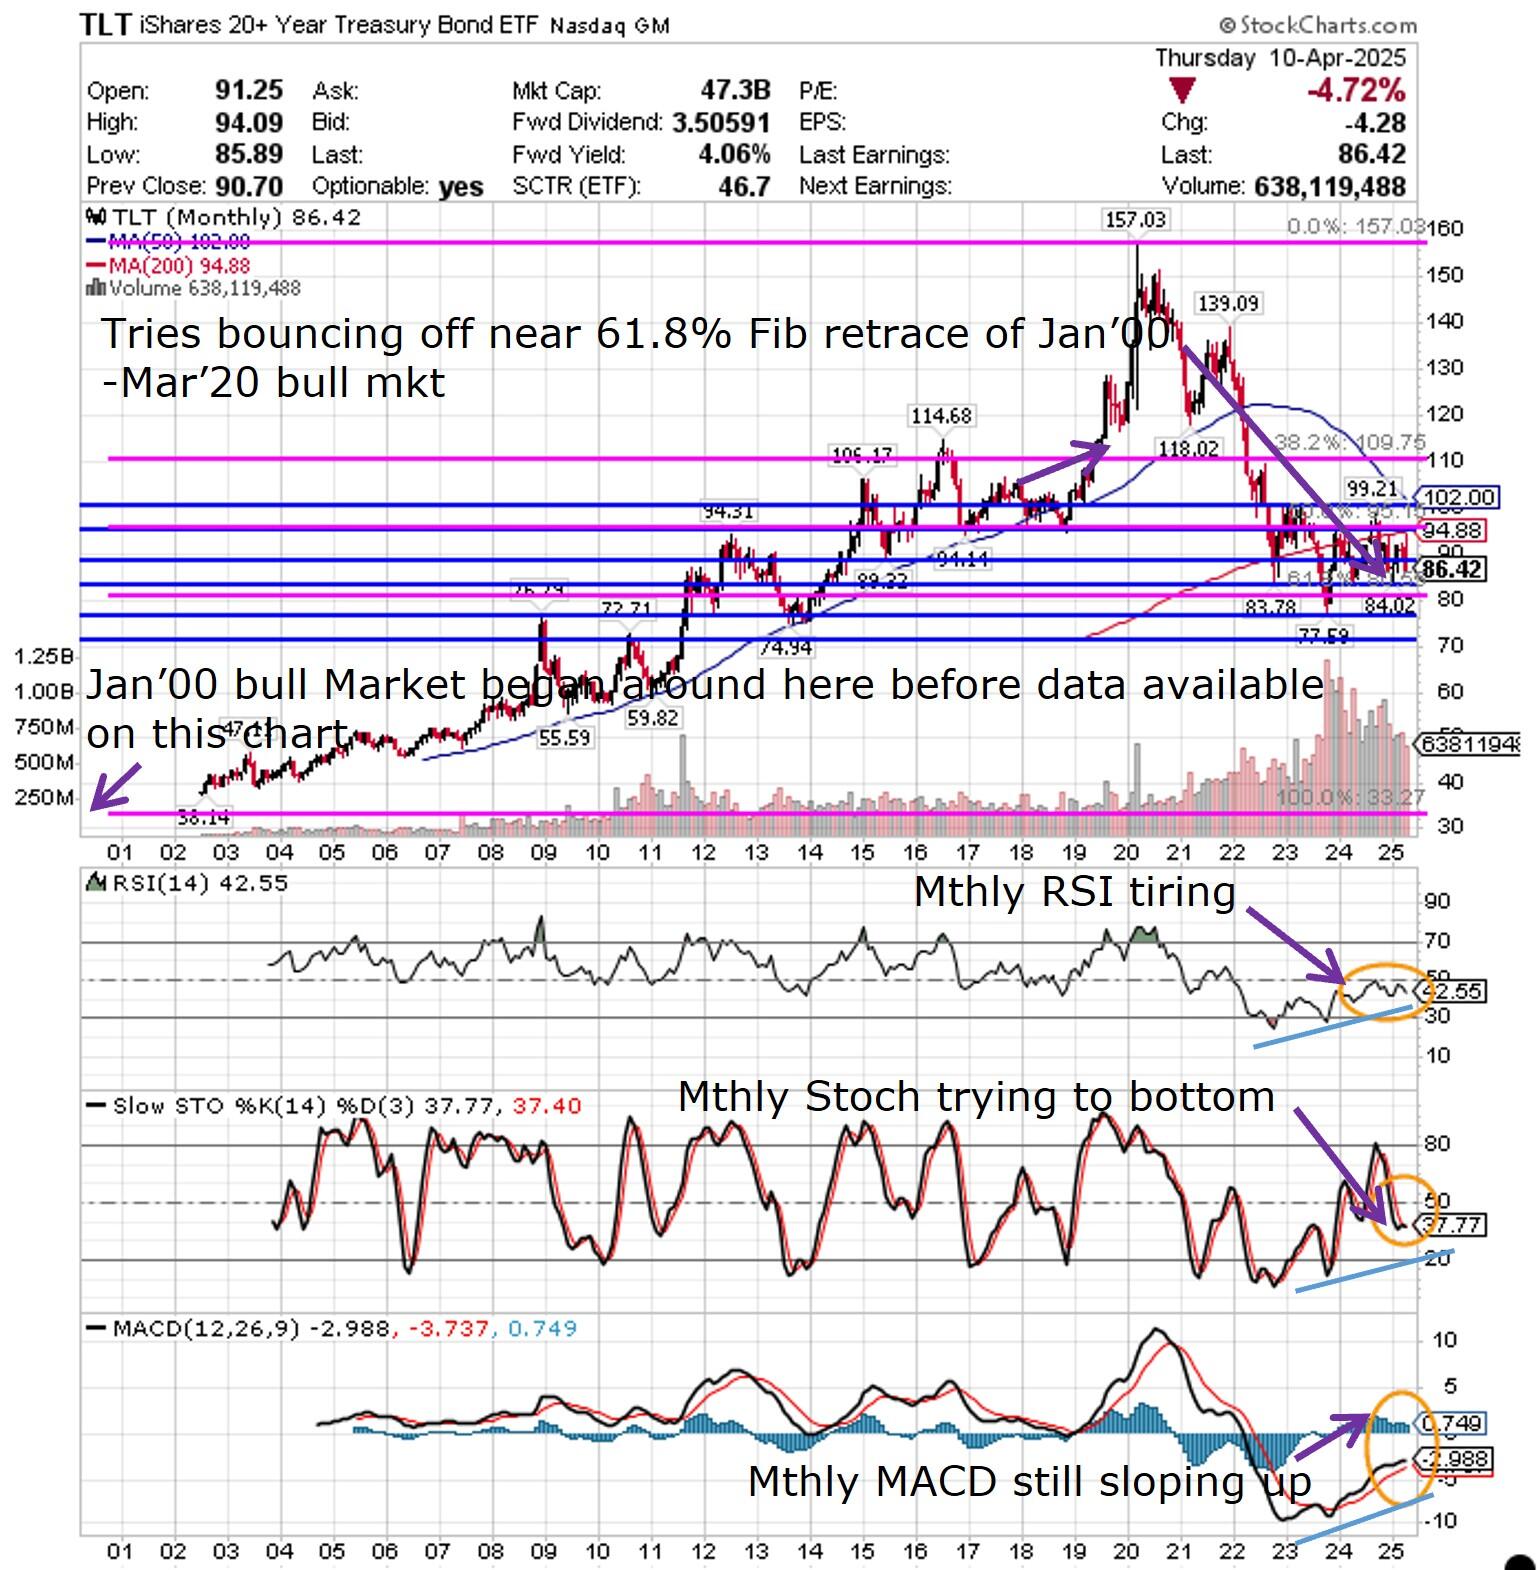
More importantly than bailing out the US equity markets has been the suggestion of JP Morgan’s Jamie Dimon (and undoubtedly many others) to ensure the US Treasury market does not further meltdown. Recent bond auctions have been lacklustre in some cases with talks of a potential bailout of some of the largest hedge funds that have been hit hard on some of their US Treasuries trades, where with some particular highly leveraged trades, they step into the US Treasury market acting as dealers where bank dealer balance sheets have had to redirect elsewhere since the dust settled from the GFC due to regulatory capital requirements, etc. With the unsustainable US government debt load of ~USD 36T, and the massive annual interest on that debt at ~USD 1T, fear is rising that US Treasury issuances will no longer be fully bought up, which could erode confidence in the US dollar. The big picture technical analysis of US Treasuries can be seen in the TLT iShares 20+ year Treasury Bond ETF 25 year monthly chart below, where it is arguably testing the 61.8% Fib retrace of the massive Jan 2020 to Mar 2020 bull market.
Monthly
US Dollar
In the following 25 year monthly chart of the US Dollar Index, we can see what this means for the US Dollar potentially where if US Treasuries lose their traditional safe haven status, the massive uptrend from Sep 2011 to Sep 2022 of the US Dollar Index is at risk of ending this year.
Monthly
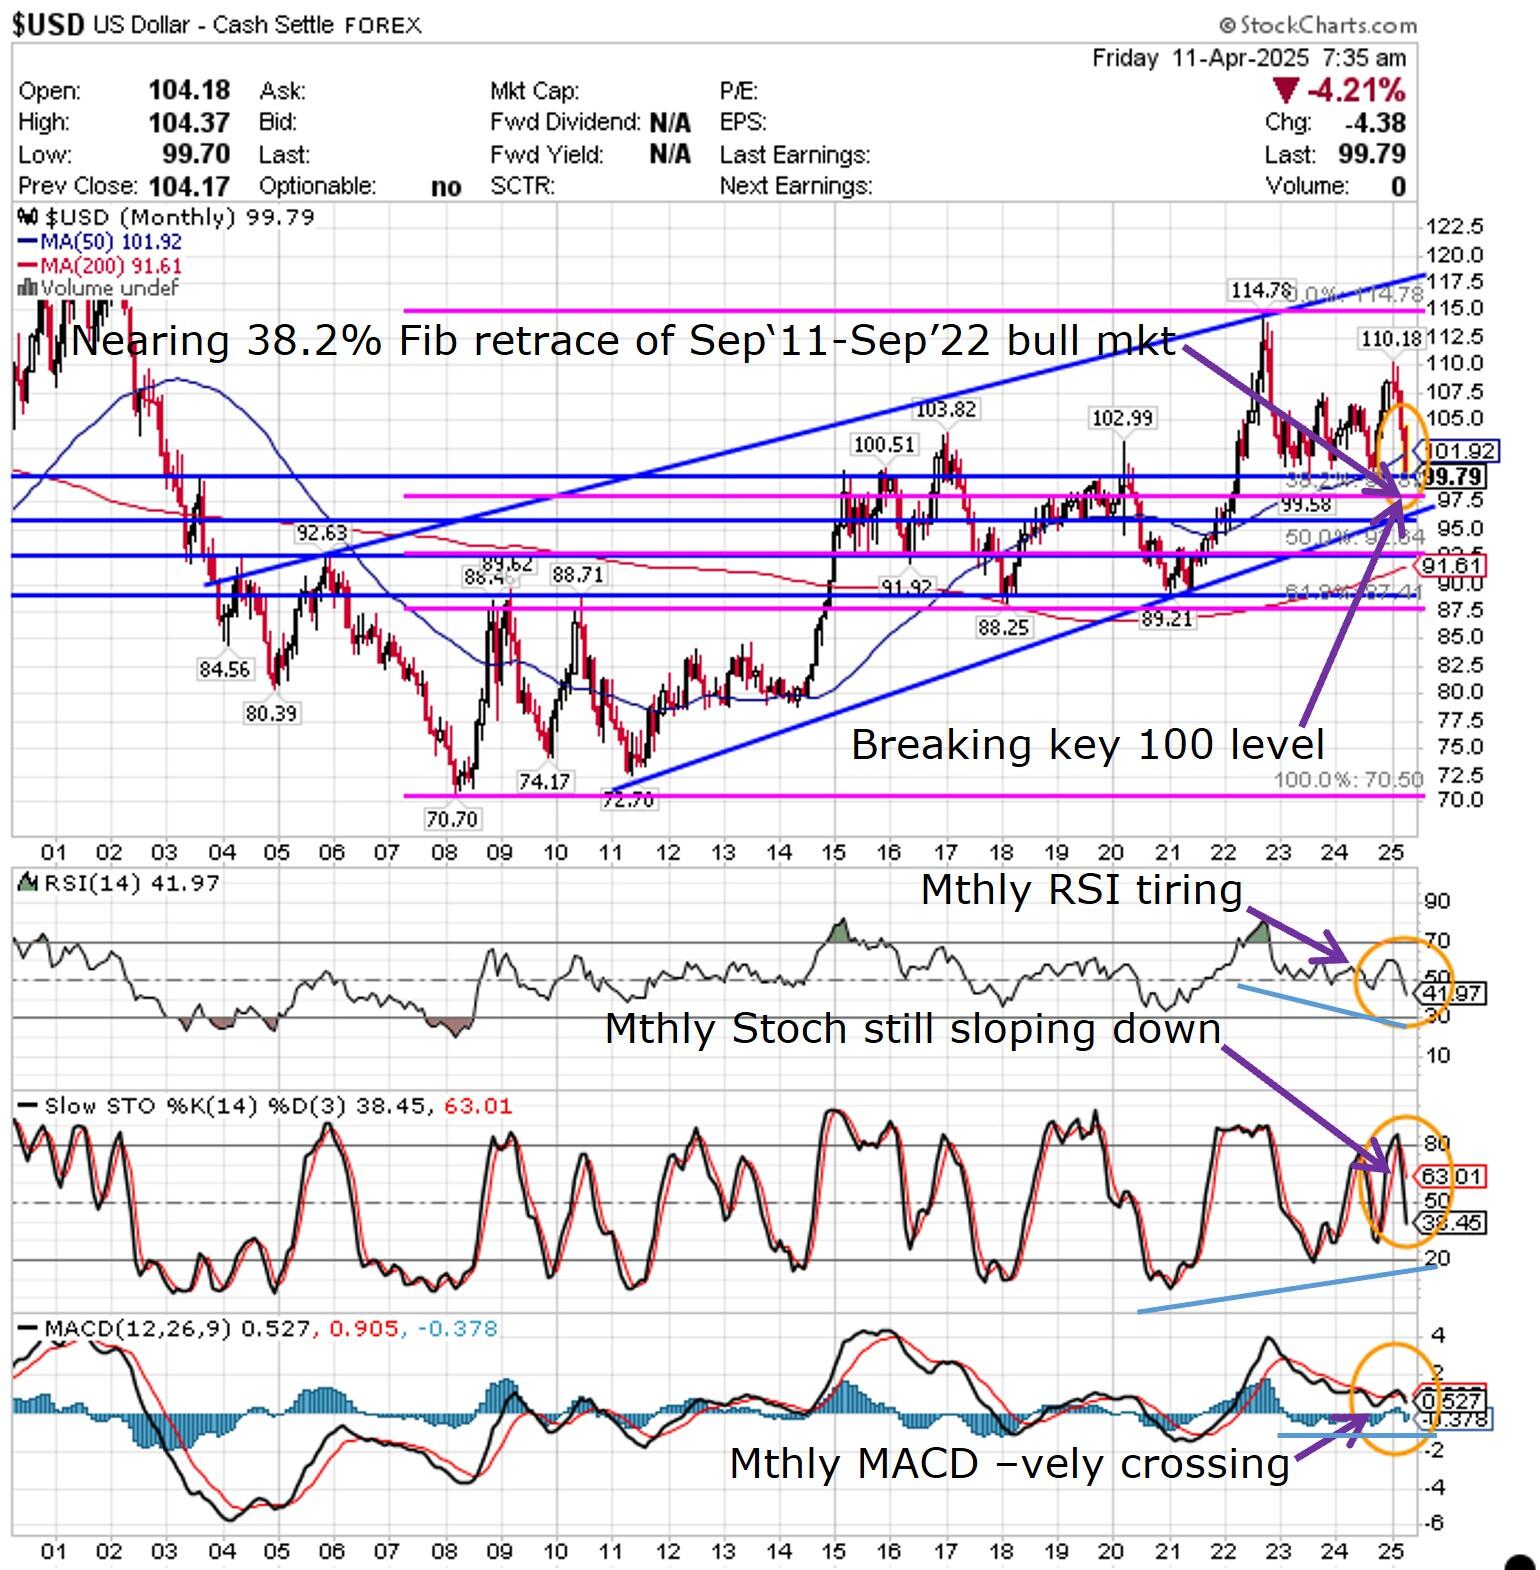
Odds are now moderate for a break of the above chart’s uptrend support connecting the key lows of 2011 and 2021 by sometime this year. US Dollar bears should not rule out though the US Dollar Index first finding multi-week, to multi-month support once it hits the 38.2% Fib retrace of its Sep 2011 to Sep 2022 bull market. Watch for any further announcements today, this weekend and early next week for any positive developments over agreements between the Trump administration and US trading partners particularly regarding the reduction of tariffs and trade barriers. US earnings next week will continue playing second fiddle to the global macro, geopolitical backdrop. With rising probabilities for massive Chinese monetary stimulus or a strong Yuan depreciation announced in the next week or so to soften the blow from the US-China trade war, some Chinese capital will leak into Bitcoin (and to a lesser extent Ether).
Bitcoin
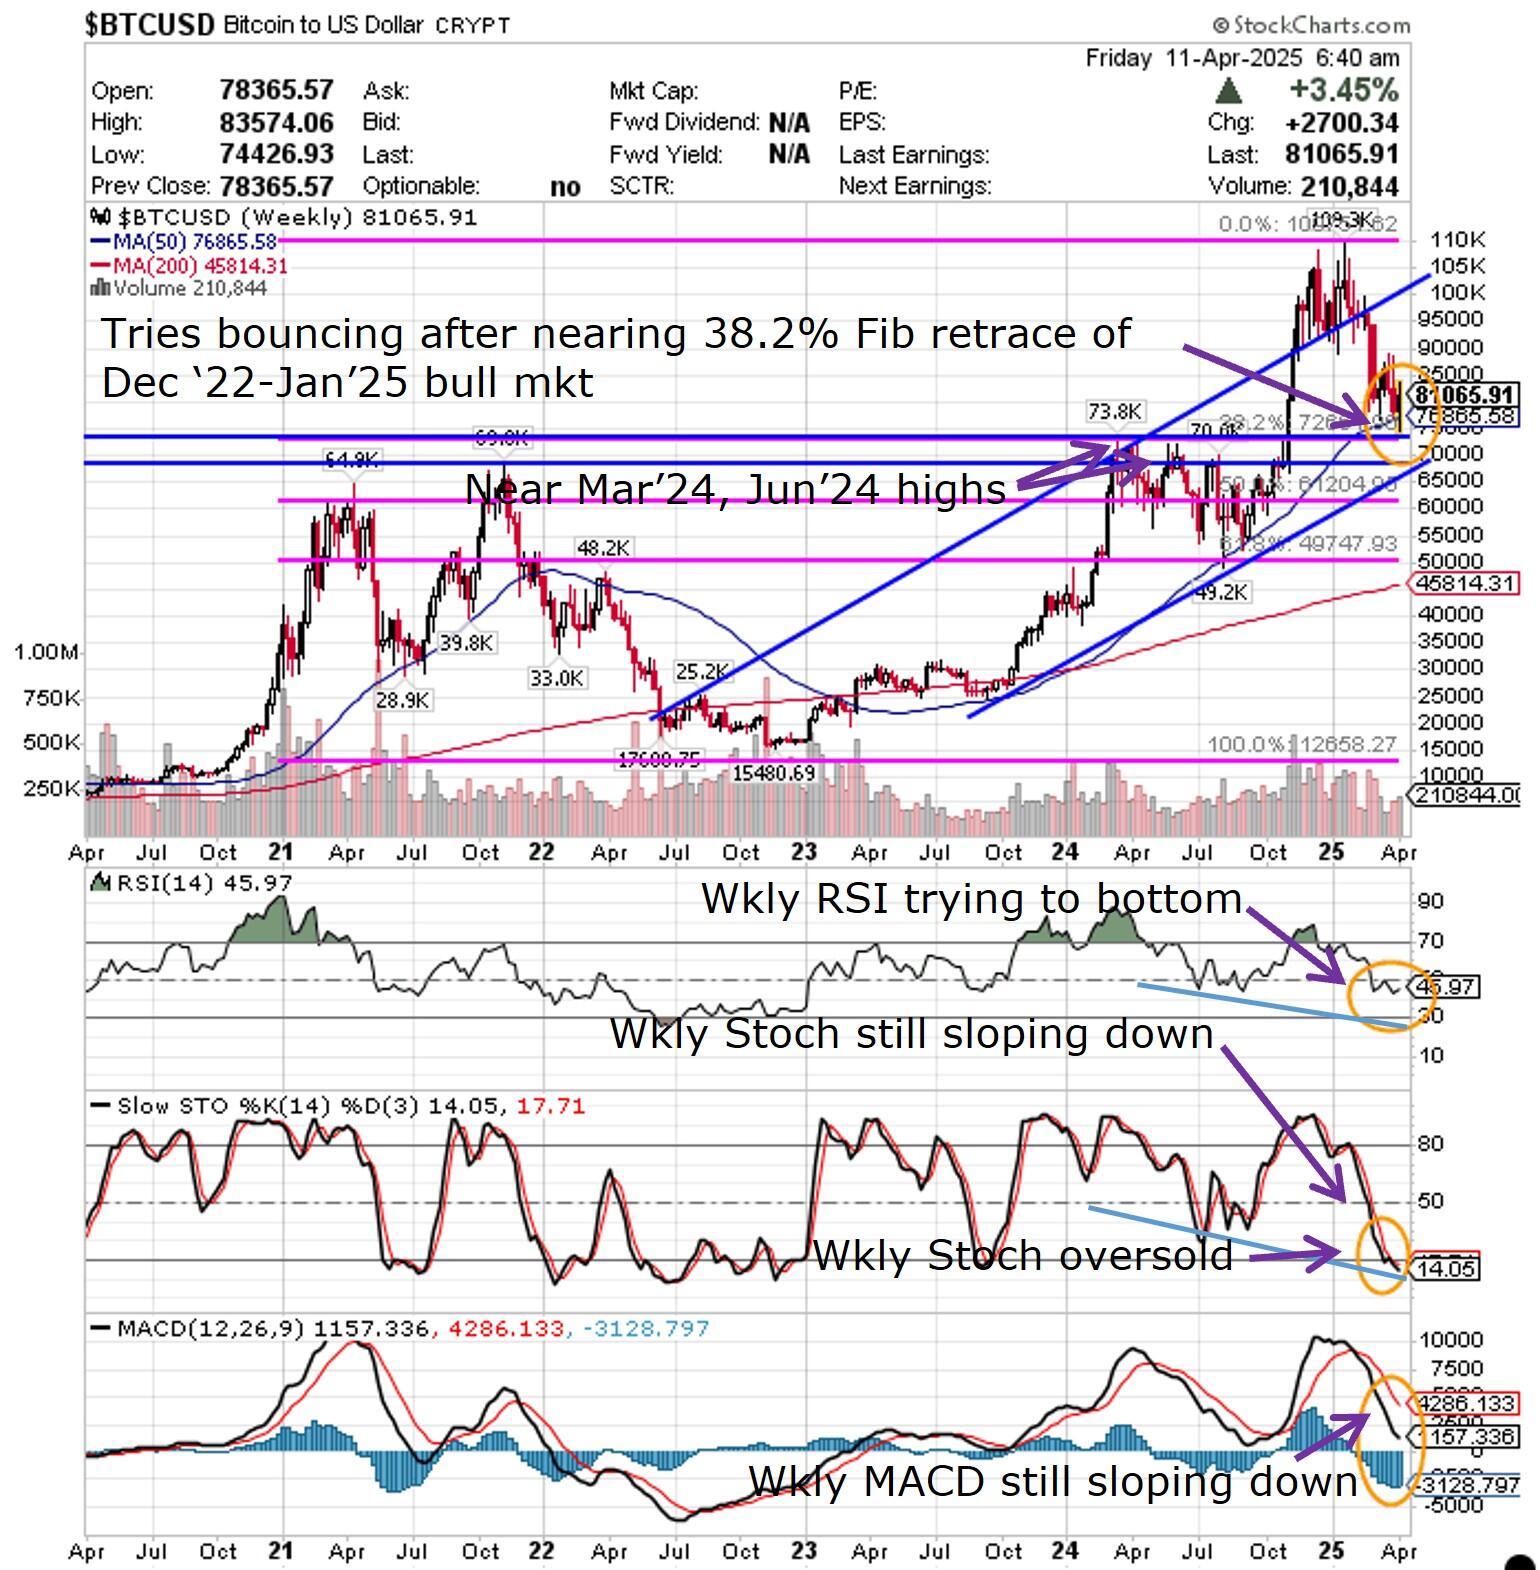
Fortunately for BTCUSD bulls or those playing a short-term bounce, BTCUSD is gaining in strength off of the strong rebound that began around Wednesday’s FOMC Meeting Minutes. BTCUSD refused to slide this week to the 38.2% Fib retrace of the massive December 2022 to January 2025 bull market (as can be seen in the weekly chart below), just above the highs of March and June 2024. Regardless of any further upside to the short covering for the balance of April, BTCUSD appears to want to slide further to an uptrend support connecting the October 2023, August 2024 and September 2024 lows (on the weekly chart) by Q3. A base, conservative scenario by year end is for BTCUSD to test the 50% Fib retrace of the late 2022-early 2025 bull market (coinciding roughly with the peaks of April and November 2021). There is a medium to low probability for now of testing within the same period, the 61.8% Fib at just above the 2024 low of psychologically key 50k whole figure level. BTCUSD has been outperforming the Nasdaq100 today and appears to want to further strengthen on today’s 830am EST US PPI and 10am EST preliminary UoM consumer sentiment and inflation expectations.
Weekly
Author

Darren Chu, CFA
Tradable Patterns
Darren Chu, CFA, ex-Intercontinental Exchange | NYSE Liffe, TMX Group, CMC Markets, is the founder of Tradable Patterns – a publisher of futures/FX technical analysis on Bloomberg, LSEG (Refinitiv) and Factset.


