Gold during Presidential Election Cycle

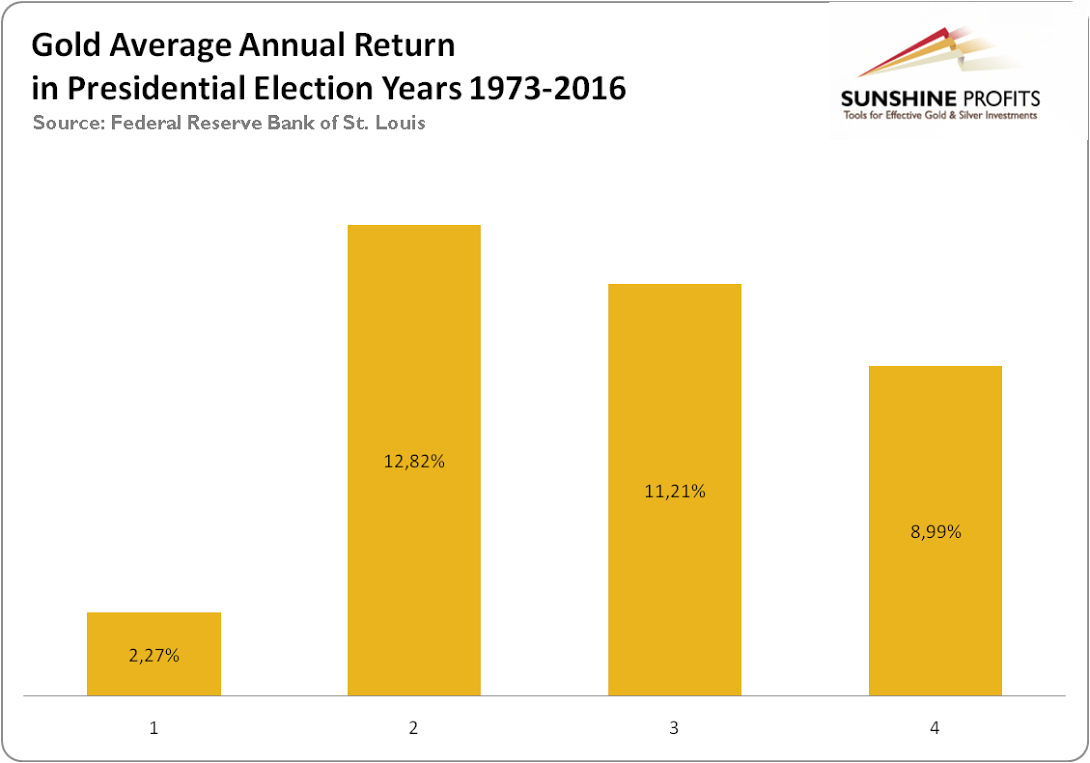
Let's analyze the chart below which shows how gold performed each year of the presidential election cycle. The first year of a presidency is a post-election year, the second is called the midterm election year, the third is the pre-election year, and the last year is an election year. For the yellow metal, the post-election year is the worst, as it gains only 2.27 percent, on average. On the contrary, the second year of the presidency is the best for the price of gold, as the shiny metal rallies 12.82 percent, on average. The pre-election (11.21 percent) and election (8.99 percent) years are between, but gold's highest performance is evidently closer to the midterm year.
Chart 1: The average annual return of gold (London P.M. Fix) in presidential election years between 1973 and 2016.
The data clearly falsifies the implications of the political business cycle. Although it is true that equities perform relatively weak in the first half of a president's term and much better during the second half, the price of gold does not reflect the stocks' behavior. Actually, the first half is worse for the yellow metal. The first two charts also show that gold is not always negatively correlated with the stock market, but often both are determined by external macroeconomic or political factors.
However, investors should be aware that our analysis is based on rather few observations. It is very sensitive to the period chosen and the pattern does not always hold. For example, during presidential election cycle 1973-1976, gold performed the strongest in the first year after Nixon's re-election.
Having said that, investors should be aware that 2017 will be a post-election year, when gold usually performs relatively weak. We are a bit skeptical as to whether we can apply such a historical analysis to the current environment of sluggish global economic growth and negative interest rates in many countries, but the difference between gold's performance in a post-election year and other years is too large to ignore.
And what about silver stocks and gold stocks? Let's have a look below where we present the average annual returns of gold, silver, the general stock market (S&P) and gold equity indices (XAU and HUI).
Chart 2: The average annual return of S&P (1948-2015, green line),gold (London P.M. Fix, 1972-2015, yellow line), silver (London Fix, 1972-2015, blue line), XAU Index (1984-2015, purple line) and HUI Index (1997-2015, red line) in presidential election cycles.
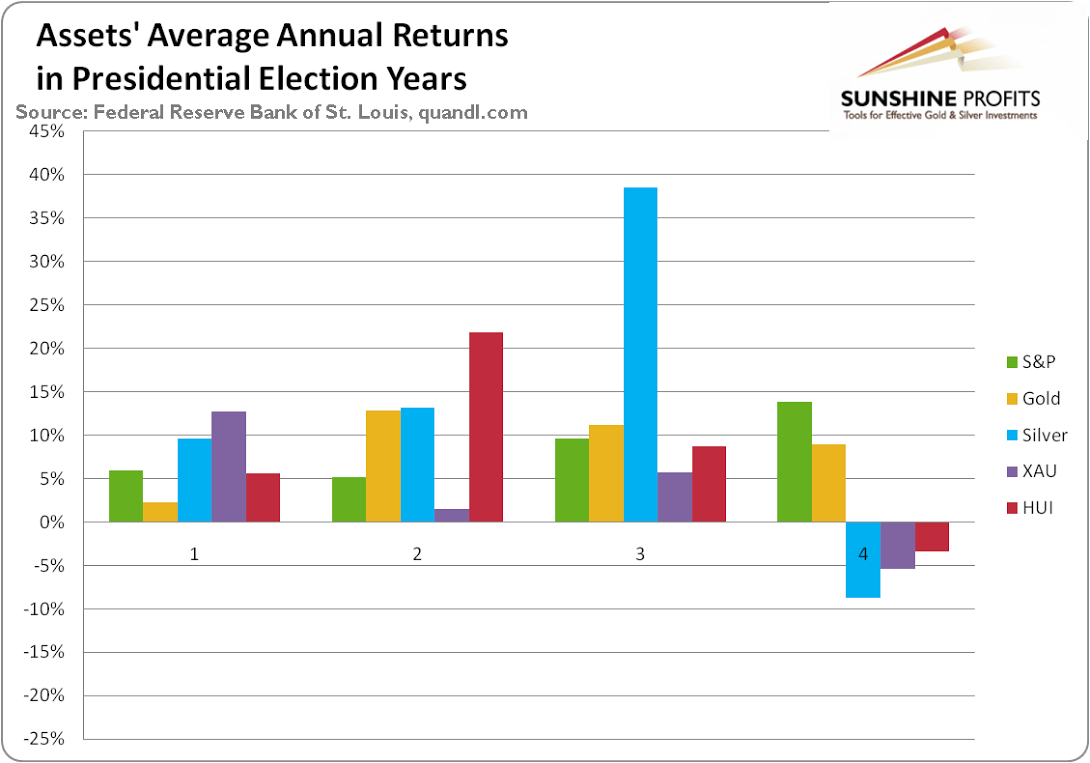
As can be seen, there is hardly any clear pattern. Gold performs the strongest in the midterm election year and the weakest in the post-election year while for silver, the pre-election year is the best year, and the election year is the worst. Both metals prefer the second half of the president's term, but it is only because of the unique rally in silver prices in 1979. The general stock market behaves accordingly to the theory of the political business cycle and performs better during the second half of the election cycle. But gold stocks prefer the first half of the term and hate the election year. However, the XAU index loves the post-election year, while the HUI index is the strongest during midterm (please note that XAU outperforms HUI when silver outperforms gold as XAU consists of both: silver and gold miners, while HUI only includes gold miners).
Guided by this analysis, in general, investors should bet on gold, get silver, and get rid of gold miners from the portfolio in election years. But this year it wouldn't be the smartest move, at least so far. Investors preparing for 2017 should underweight their positions in gold and overweight in silver or the XAU index, however they should be aware the data series for gold equity indices are particularly short and include few presidential election cycles. Therefore, drawing conclusions based on this comparison, only, without considering trading and fundamental factors, is risky for the investor.
If you enjoyed the above analysis and would you like to know more about the consequences of the U.S. presidential elections for the gold market, we invite you to read the September Market Overview report. If you're interested in the detailed price analysis and price projections with targets, we invite you to sign up for our Gold & Silver Trading Alerts. If you're not ready to subscribe at this time, we invite you to sign up for our gold newsletter and stay up-to-date with our latest free articles. It's free and you can unsubscribe anytime.
Want free follow-ups to the above article and details not available to 99%+ investors? Sign up to our free newsletter today!
Author

Arkadiusz Sieroń
Gold Price Forecast
Arkadiusz Sieroń received his Ph.D. in economics in 2016 (his doctoral thesis was about Cantillon effects), and has been an assistant professor at the Institute of Economic Sciences at the University of Wrocław since 2017.


