|

GBP/USD Forecast: Holding near a critical Fibonacci resistance

GBP/USD Current Price: 1.2453

  • UK PM Johnson left hospital his health continues to improve.
  • The pandemic-related crisis in the UK set to deepen in the upcoming weeks.
  • GBP/USD needs to advance beyond 1.2515 to become attractive for bulls.

The GBP/USD pair has finished the week with gains around 1.2450, after topping at 1.2486 on Friday. It was the third consecutive week the pair reached the 1.2480 price zone and was unable to advance beyond it. The Sterling benefited from the broad dollar’s weakness and news indicating that UK PM Johnson is recovering from coronavirus. After spending some days in the ICU, reports came on Sunday that he has left the hospital, bringing some relief to those concerned about the UK leadership. There are other Cabinet members affected by coronavirus and quarantine, and Raab continues to lead the kingdom.

Meanwhile, the pandemic continues spreading in the UK with roughly 80,000 cases and the death toll nearing 10,000. The late response of the UK government to the pandemic suggests that the crisis may deepen in the upcoming weeks. Most markets will remain closed this Monday, included London, with no data scheduled to release.

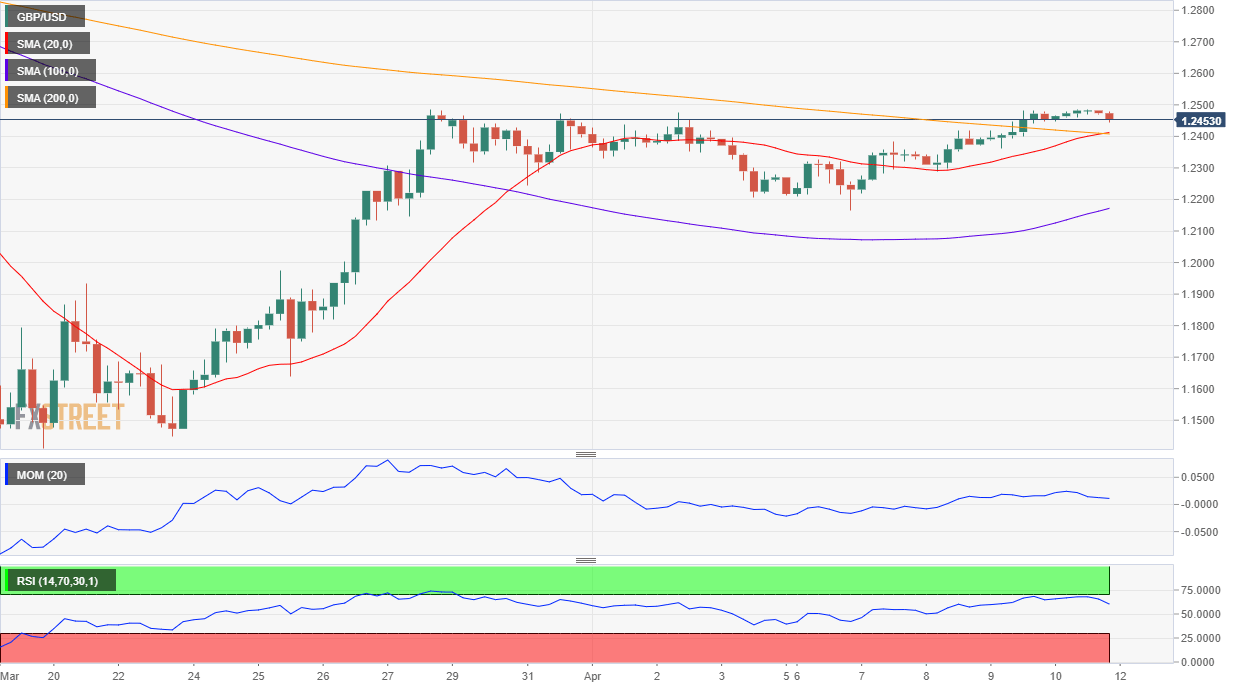
GBP/USD short-term technical outlook

The GBP/USD pair is trading at the upper end of its latest range and close to a critical Fibonacci level, the 61.8% retracement of its latest weekly slump at 1.2515. In the daily chart, the pair is neutral-to-bullish as it extended its advance above a now flat 20 SMA, while the Momentum indicator advances in overbought territory. The RSI, however, is flat around its mid-line. In the shorter-term, and according to the 4-hour chart, the bullish potential is limited, given that the pair is hovering around its 20 and 200 SMA, both directionless, while technical indicators turned south, nearing neutral readings. Things could change if the pair firms up above the mentioned Fibonacci resistance.

Support levels: 12420 1.2370 1.2320

Resistance levels: 1.2515 1.2560 1.2600

View Live Chart for the GBP/USD

Author

Valeria Bednarik

Valeria Bednarik was born and lives in Buenos Aires, Argentina. Her passion for math and numbers pushed her into studying economics in her younger years.

More from Valeria Bednarik
Share:

Markets move fast. We move first.

Orange Juice Newsletter brings you expert driven insights - not headlines. Every day on your inbox.

By subscribing you agree to our Terms and conditions.

Editor's Picks

EUR/USD: Bulls pray for a dovish Fed

EUR/USD has finally taken a breather after a pretty energetic climb. The pair broke above 1.1680 in the second half of the week, reaching its highest levels in around two months before running into some selling pressure. Even so, it has gained almost two cents from the late-November dip just below 1.1500 the figure.

GBP/USD trims gains, recedes toward 1.3320

GBP/USD is struggling to keep its daily advance, coming under fresh pressure and retreating to the 1.3320 zone following a mild bullish attempt in the Greenback. Even though US consumer sentiment surprised to the upside, the US Dollar isn’t getting much love, as traders are far more interested in what the Fed will say next week.

Gold: Bullish momentum fades despite broad USD weakness

After rising more than 3.5% in the previous week, Gold has entered a consolidation phase and fluctuated at around $4,200. The Federal Reserve’s interest rate decision and revised Summary of Economic Projections, also known as the dot plot, could trigger the next directional move in XAU/USD. 

Week ahead: Rate cut or market shock? The Fed decides

Fed rate cut widely expected; dot plot and overall meeting rhetoric also matter. Risk appetite is supported by Fed rate cut expectations; cryptos show signs of life. RBA, BoC and SNB also meet; chances of surprises are relatively low. Dollar weakness could linger; both the aussie and the yen best positioned to gain further. Gold and oil eye Ukraine-Russia developments; a peace deal remains elusive.

The Silver disconnection is real

Silver just hit a new all-time high. Neither did gold, nor mining stocks. They all reversed on an intraday basis, but silver’s move to new highs makes it still bullish overall, while the almost complete reversals in gold and miners make the latter technically bearish.

Ripple faces persistent bear risks, shrugging off ETF inflows

Ripple is extending its decline for the second consecutive day, trading at $2.06 at the time of writing on Friday. Sentiment surrounding the cross-border remittance token continues to lag despite steady inflows into XRP spot ETFs.