GBP/USD Forecast: Exposing its weakness ahead of the NFP
- GBP/USD has been struggling to extend its gains amid growing political uncertainty.
- The US Non-Farm Payrolls is in the spotlight.
- Friday's four-hour chart shows a mixed technical picture.

What cannot go up, must come down – goes the saying – and that may be Sterling's fate today. Nigel Farage's Brexit Party lost to Labour in a by-election in Peterborough. Farage's victory in the EU elections does not extend to Westminster politics and this should have been positive for the pound that rises with hopes for a softer Brexit. Yet if GBP/USD cannot ride higher on good news – it is exposing its weakness.
UK PM Theresa May has officially stepped down as leader of the Conservative Party, following her dramatic announcement two weeks ago. The contest to succeed her officially begins on Monday when the dozen or so contenders will formally nominate themselves. Tories aim to conclude the process by July 22nd.
Former foreign secretary Boris Johnson remains the leading candidate, but he faces challenges from both hard-Brexiteers such as Dominic Raab, and also from those who hold softer views, Michael Gove and Jeremy Hunt.
In the US, tension is mounting towards the Non-Farm Payrolls. Economists expect an increase of 185K positions and annual pay rises of 3.2%. A disappointing figure may boost the probabilities of a rate cut by the Fed – that Chair Jerome Powell alluded to earlier this week.
See:
- US Non-Farm Payrolls Preview: Worried, but the signs are steady
- Nonfarm Payrolls preview: can it bend Fed's hand?
Trade tensions are intensifying after the second round of US-Mexican talks ended without a deal and US-Sino tensions remain elevated. Negotiations on both fronts continue today and tomorrow.
Overall, markets have many issues on their collective minds.
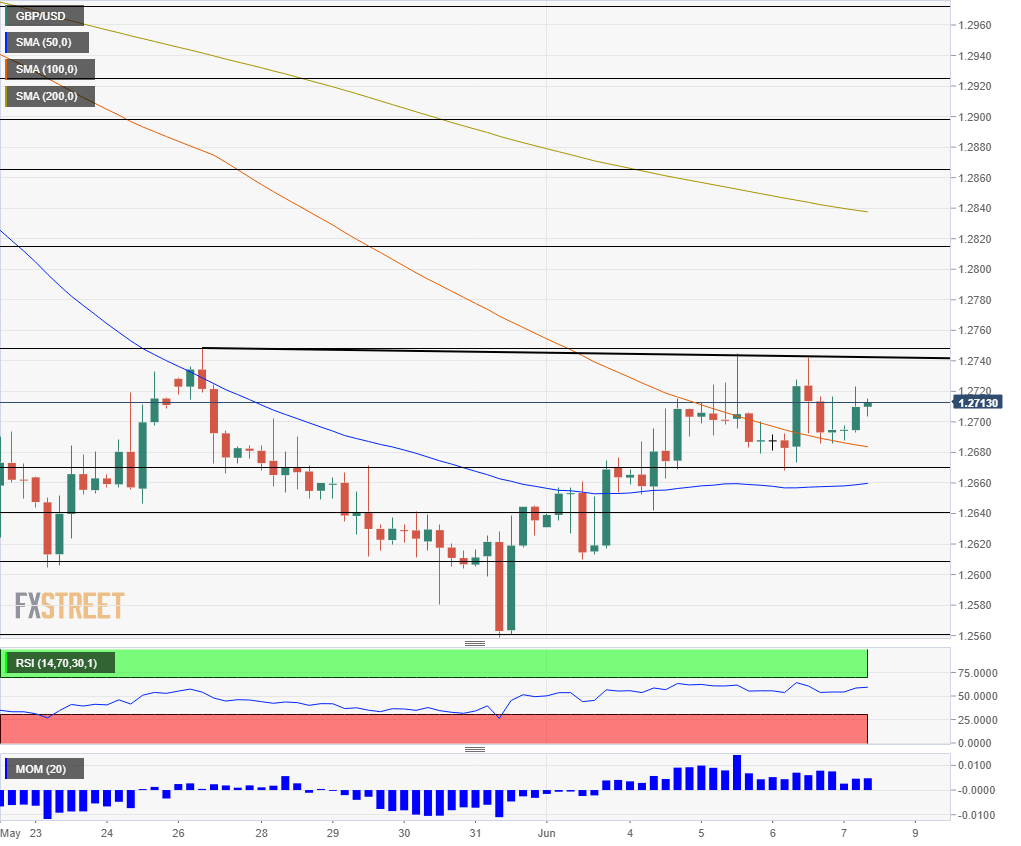
GBP/USD has made a third attempt to break above 1.2750 which looks like a triple top at first sight. However, a closer look shows that each peak is lower than the previous one. These lower highs are a bearish sign.
Other indicators are relatively positive – GBP/USD is trading above the 50 and 100 Simple Moving Average, momentum is to the upside, and the Relative Strength Index is rising.
Above 1.2750, cable faces resistance at 1.2815, which was a swing high in mid-May, and 1.2870 that was the low point in April.
Thursday's low at 1.2670 is the initial support line. It is followed by 1.2640 that was a swing low in early June, then by 1.2620 and finally, by 1.2558 which was seen in late May and is the lowest since January.
Author

Yohay Elam
FXStreet
Yohay is in Forex since 2008 when he founded Forex Crunch, a blog crafted in his free time that turned into a fully-fledged currency website later sold to Finixio.


