S&P 500 (cash) near term outlook:
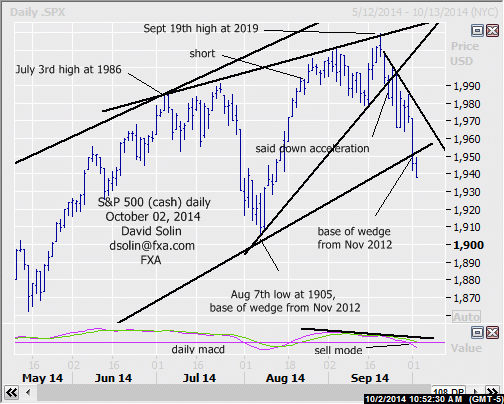
In the Sept 23rd email (email me if you need a copy), affirmed the view of a topping (potentially more major topping, see longer term below), adding there was scope for a downside acceleration directly ahead as the market had broken the base of the rising wedge since July (then at 1992). The market has indeed declined sharply since, yesterday taking out the base of the even larger rising wedge from Nov 2012 (currently at 1952/55, see daily chart below). As previously discussed, there was scope for a sharp tumble into the late Oct timeframe (and even longer, potential "crash" ?), with the break of this wedge adding to the potential (rising wedges are seen as reversal patterns that often resolve sharply lower). Note too the slew of other negatives remain and include bearish technicals, time cycles that are sharply lower into late in the year (previously discussed Bradley Model), within the often dangerous October timeframe, and lots of divergences (underperformance of mid/small caps, see Russell 2000, advance/decline, etc.). Resistance is now at the broken base of the large wedge since Nov 2012 (currently at 1550/55) and the bearish trendline Sept 20th (currently at 1980/85). Support is seen at 1902/07 (Aug 7th low). Bottom line : view of a declines (potential plunge) into at least the late Oct timeframe playing out.
Near term strategy/position:
Reached the sell target from the Aug 15th email at 1990 on Aug 21st. For now, would stop on a close 5 pts above that bearish trendline from Sept 20th, but will want to get more aggressive if the market does indeed continue to accelerate lower ahead.
Long term outlook:
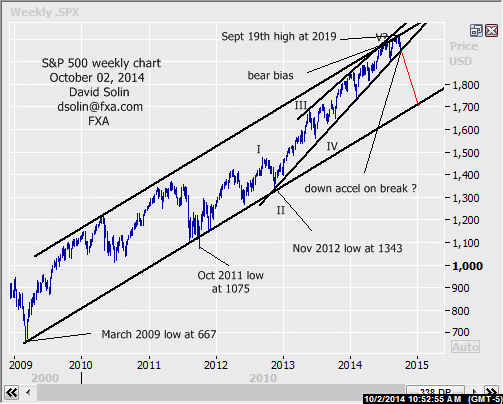
As discussed above, looks like the view of sharply lower prices into at least the late Oct timeframe is indeed playing out. Note too that a number of more major, long term negatives remain, and continues to argue potential for a more significant top (9-12 months or more). No doubt the market is very overbought after the huge surge from the March 2009 low at 667, appear to be within the final upleg in the rally from at least the Oct 2011 low at 1075 (wave V), and the market has indeed broken down from the "rising wedge in a larger rising wedge" pattern. Initial downside target/support is seen at 1655/65 (both the base of the huge bullish channel since the March 2009 low at 667 and a 38% retracement from the Nov 2012 low at 1343, see in red on weekly chart/2nd chart below). Bottom line : break of the base of the large rising wedge since 2012 adding to the view of sharp declines toward an initial 1655/65 ahead (may be sharp).
Long term strategy/position:
Also switched the longer term bias to the bearish side on Aug 21st at 1990.
Current:
Nearer term: reached the sell target from the Aug 15th email at 1990 on Aug 21st.
Last: short Apr 10 at 1861, stopped May 27th at 1912.
Longer term: bearish bias Aug 21st at 1990, some potential of a more major top (9-12 months).
Recommended Content
Editors’ Picks
AUD/USD regains the constructive outlook above the 200-day SMA

AUD/USD advanced strongly for the second session in a row, this time extending the recovery to the upper 0.6500s and shifting its focus to the weekly highs in the 0.6580-0.6585 band, an area coincident with the 100-day SMA.
EUR/USD recovers to top end of consolidation ahead of Friday’s US NFP

EUR/USD drove back to the top end of recent consolidation on Thursday, recovering chart territory north of the 1.0700 handle as market risk appetite regains balance heading into another US Nonfarm Payrolls Friday.
Gold price pullback on Fed hawkish tilt amidst lower US yields, weaker US Dollar

Gold price clings to the $2,300 figure in the mid-North American session on Thursday amid an upbeat market sentiment, falling US Treasury yields, and a softer US Dollar. Traders are still digesting Wednesday’s Federal Reserve decision to hold rates unchanged.
Bitcoin price rises 5% as BlackRock anticipates a new wave of capital inflows into BTC ETFs from investors

Bitcoin (BTC) price slid to the depths of $56,552 on Wednesday as the cryptocurrency market tried to front run the Federal Open Market Committee (FOMC) meeting. The flash crash saw millions in positions get liquidated.
FOMC in the rear-view mirror – NFP eyed

The update from May’s FOMC rate announcement proved more dovish than expected, which naturally weighed on the US dollar (sending the DXY to lows of 105.44) and US yields, as well as, initially at least, underpinning major US equity indices.

