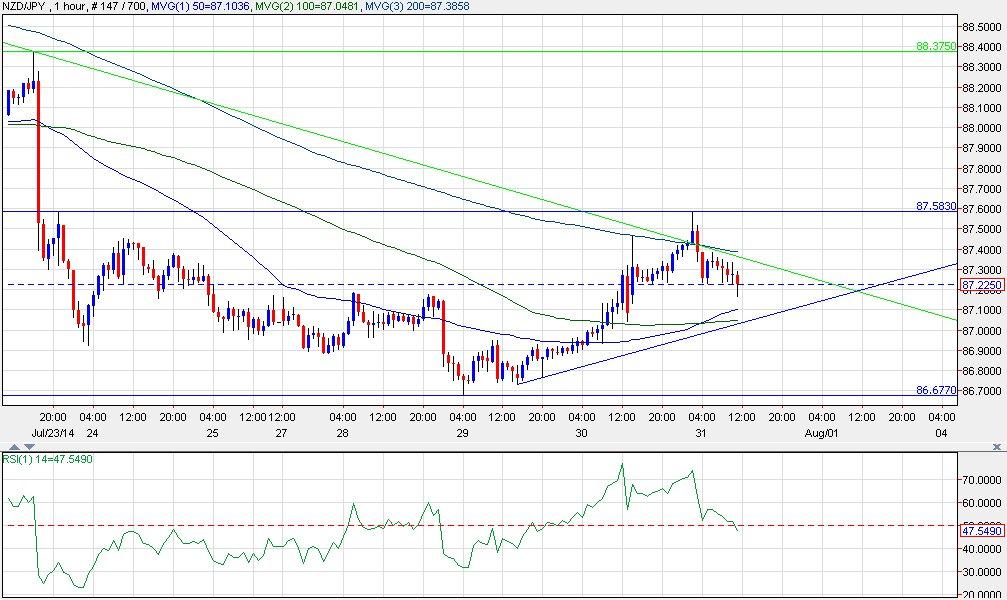
A break below 87.00 is likely a sign of bearish continuation, especially if the 1H RSI falls back below 40. But even before a break below 87.00, we might want to consider shorting the NZD/JPY around 87.40.
NZD/JPY 1H Chart 7/31

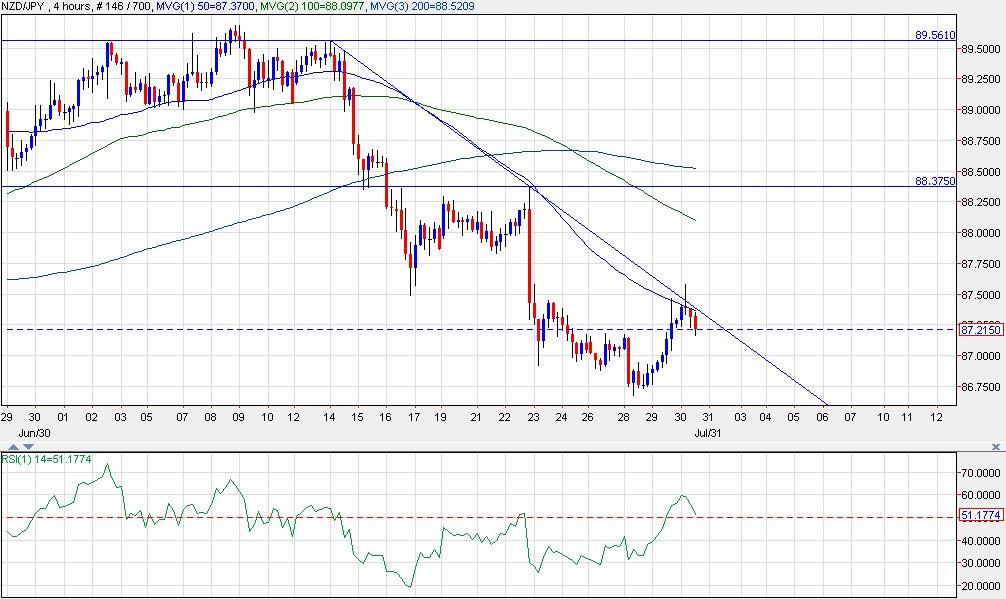
The 4H NZD/JPY chart shows a falling trendline connecting 89.56 and 88.37. If the recent bearish trend is to continue, holding below the 87.50 area would be key. So far, even though there was some breach of this trendline and the 87.50 level, price has immediately retreated below it.
The 4H RSI came up to 60 and is turning down. After tagging 30 earlier last week, being able to hold below 60 is a sign that bearish momentum is maintained. The RSI also offers a negative reversal signal. This refers to higher RSI high, corresponding with a lower price high. This suggests another low is pending.
NZD/JPY 4H Chart 7/31

With that in mind, there is a downside risk below 86.75. The 85.86 May-low could be the next key support. Let's say the target is then, 86.00. If price pops up above 87.70 , it is likely getting into a larger consolidation period, if not a bullish continuation. So, a stop can be placed at 87.85.
Let's assess a trade plan to short entry at 87.40. This stop placement and downside projection gives an entry at 87.40 a potential reward of 140 pips, and potential risk of 45 pips. This is a reward to risk ratio of around 3:1.
Recommended Content
Editors’ Picks
AUD/USD regains the constructive outlook above the 200-day SMA

AUD/USD advanced strongly for the second session in a row, this time extending the recovery to the upper 0.6500s and shifting its focus to the weekly highs in the 0.6580-0.6585 band, an area coincident with the 100-day SMA.
EUR/USD keeps the bullish performance above 1.0700

The continuation of the sell-off in the Greenback in the wake of the FOMC gathering helped EUR/USD extend its bounce off Wednesday’s lows near 1.0650, advancing past the 1.0700 hurdle ahead of the crucial release of US NFP on Friday.
Gold stuck around $2,300 as market players lack directional conviction

Gold extended its daily slide and dropped below $2,290 in the second half of the day on Thursday. The benchmark 10-year US Treasury bond yield erased its daily losses after US data, causing XAU/USD to stretch lower ahead of Friday's US jobs data.
Bitcoin price rises 5% as BlackRock anticipates a new wave of capital inflows into BTC ETFs from investors

Bitcoin (BTC) price slid to the depths of $56,552 on Wednesday as the cryptocurrency market tried to front run the Federal Open Market Committee (FOMC) meeting. The flash crash saw millions in positions get liquidated.
FOMC in the rear-view mirror – NFP eyed

The update from May’s FOMC rate announcement proved more dovish than expected, which naturally weighed on the US dollar (sending the DXY to lows of 105.44) and US yields, as well as, initially at least, underpinning major US equity indices.