EUR/USD
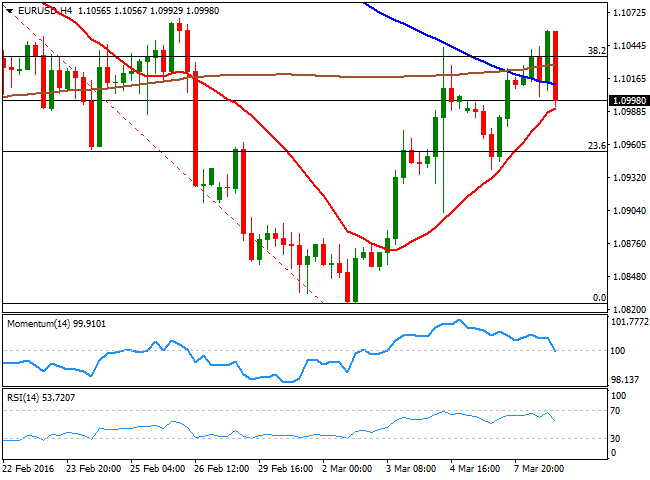
Major pairs closed the day little changed, with the exception of the JPY crosses, as the safe haven asset surged on a return of risk aversion. China fueled concerns over the economic future at the beginning of the day with the release of its trade balance figures, which showed that exports fell by 20.6% in Yuan terms and compared to a year before, while imports contracted 8.0% in February, resulting in a 210.0B surplus against the 329.0B expected and the 406.2 previous. In Europe, news were for once positive, as Germany offered some robust manufacturing data, up by 3.3% monthly basis last January, while the EU GDP in the last quarter of 2015, grew by 0.3%, in line with market's expectations. Uncertainty surrounding what the ECB may do next Thursday is also helping keep the EUR subdued, as speculation mounts on Mario Draghi delivering more than a 1015bp deposit rate cut. The broad dollar's weakness keeps the EUR/USD pair near its 2week high, but from a technical point of view, the bullish potential has decreased due to the lack of follow through. Short term, the 1 hour chart offers a neutral stance, with the price now extending below a horizontal 20 SMA, and the technical indicators mostly flat around their midlines. In the 4 hours chart, the technical indicators have turned sharply lower, and the Momentum indicator is about to cross its 100 level towards the downside. The 20 SMA however, keeps heading higher around 1.0980, providing an immediate short term support. If this last gives up, the decline can extend down to the 1.0900/20 region, with scope to test 1.0840, before strong buying interest surges.
Support levels: 1.0980 1.0950 1.0920
Resistance levels: 1.1045 1.1080 1.1120
GBP/USD
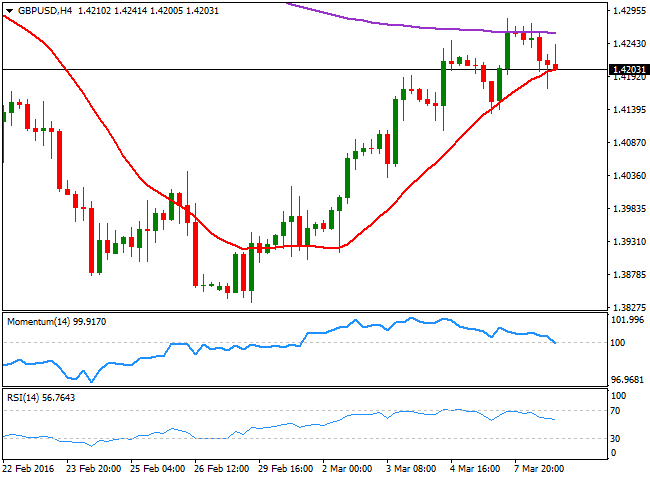
The British Pound traded heavier, easing almost a full cent against the greenback after briefly pocking through 1.4280 late Monday. Increasing risk aversion and poor performance of commodities' prices weighed on the Sterling, as no data was released in the UK. On Wednesday however, the country will release its latest manufacturing and industrial production data, which will offer more clues on the health of the kingdom. Comments from BOE's Governor Mark Carney before the Parliament, favoring remaining within the EU did little for the local currency. The pair fell down to 1.4172, and currently struggles around the 1.4200 level, with intraday charts favoring a continued decline for the Asian session, as in the 1 hour chart, the price is being capped since early Europe by a bearish 20 SMA, while the technical indicators turned south below their midlines. In the 4 hours chart, the Momentum indicator is crossing its 100 line with a sharp bearish slope, while the price keeps pressuring a still bullish 20 SMA, suggesting a break below the mentioned low should lead to a continued decline this Wednesday.
Support levels: 1.4165 1.4120 1.4070
Resistance levels: 1.4230 1.4260 1.4290
USD/JPY
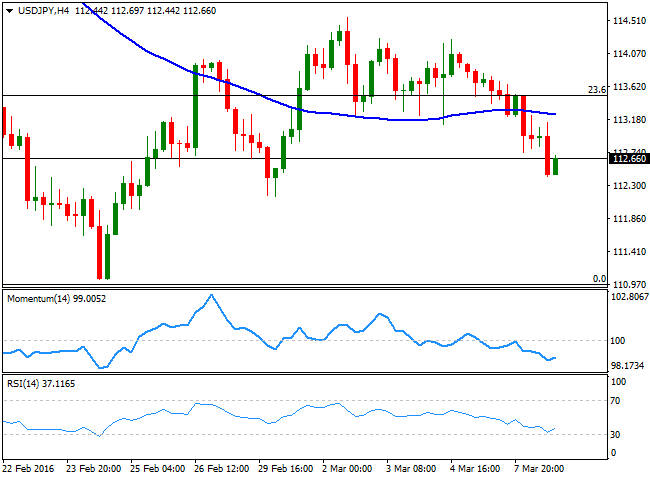
The Japanese yen outperformed its major rivals, advancing against all of its major rivals. The USD/JPY pair fell during the Asian session, as adding to increasing risk aversion, Japanese GDP resulted better than expected, contracting 0.3% in the last quarter of 2015, against market's forecast and first estimate of a 0.4% decline. The pair set a daily low of 112.41, and trades a handful of pips above it ahead of the Asian opening, retaining the bearish bias seen on previous updates. Technically, the 1 hour chart shows that the price has extended its slide well below its 100 and 200 SMAs, whilst the shortest has accelerated its decline above the largest, reflecting a strong downward momentum. The technical indicators in the mentioned time frame diverge from each other, with the RSI indicator bouncing from oversold levels, rather tracking the latest bounce than suggesting further recoveries. In the 4 hours chart, the technical indicators are giving limited signs of downward exhaustion near oversold territory, far from supporting an upcoming upward move. Should the decline extend below 112.15, the immediate support, the pair is poised to retest the 111.00 region later on the day.
Support levels: 112.15 111.60 111.20
Resistance levels: 112.70 113.20 113.50
GOLD
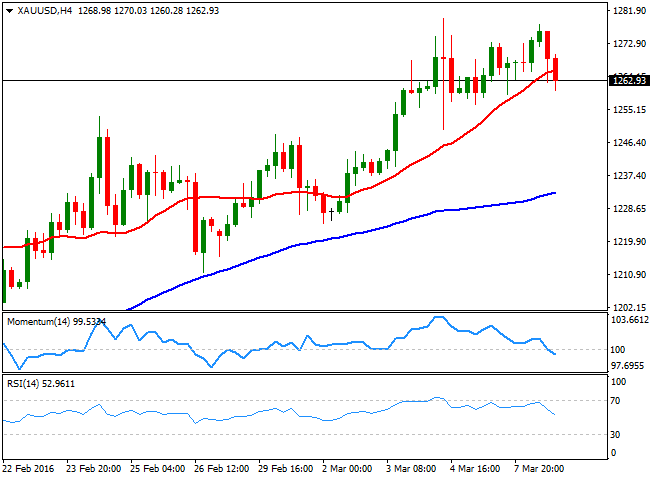
Gold started the day with a strong footing, but gave up its early gains and turned negative during the American session. Spot traded as high as $ 1,278.01, boosted by poor Chinese data. But despite the dominant riskaversion mood in financial markets, the yellow metal edged lower on Tuesday, although it remained close to a 13month high scored last week. The yellow metal finished the day slightly lower around $ 1,263.00 a troy ounce, and the upward momentum seems to be fading ahead of the upcoming risk events, in the form of Central Banks decision. Technically, the daily chart shows that the 20 SMA is losing its upward strength, but continues heading higher around 1,233.70, while the RSI is turning lower from overbought levels, suggesting some downward corrective move for this Wednesday. In the 4 hours chart, the price is breaking below its 20 SMA, whilst the technical indicators are heading lower around their midlines with strong bearish slopes, also supporting some additional declines.
Support levels: 1,256.20 1,242.50 1,233.70
Resistance levels: 1,271.80 1,279.75 1,286.90
WTI CRUDE
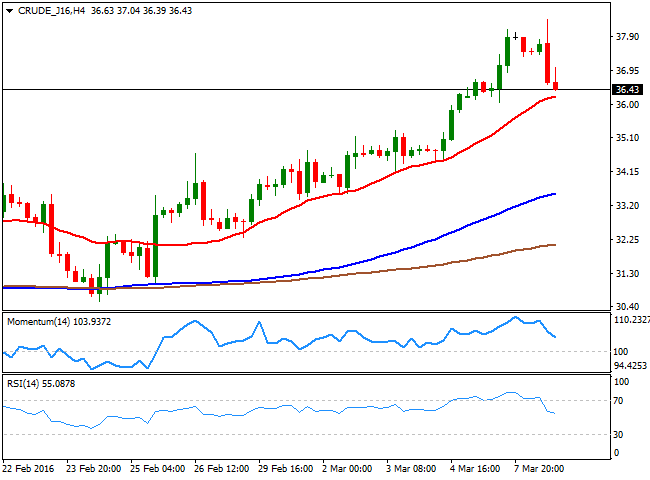
Crude oil prices retraced from its recent highs, ending the day in the red for the first time in over a week. The commodity rallied at the beginning of the day, as despite Chinese trade balance figures were below expectations, data also showed that China's oil imports hit a record high of 8.0 million barrels per day during February. West Texas Intermediate futures hit $38.38 a barrel, but fell two dollars during the American session, and neared $36.00 a barrel by the end of the day. The daily chart shows that the price is still above its 100 SMA, currently around 34.60, although the technical indicators have turned south, retreating from overbought territory. Shorter term, the 4 hours chart shows that the price is pressuring a bullish 20 SMA, whilst the technical indicators are poised to cross their midlines towards the downside. Monday's low at 36.07 comes as the immediate support, with a break below probably fueling the negative tone and exposing the commodity to a test of the mentioned 34.60 level.
Support levels: 36.06 35.30 34.60
Resistance levels: 37.20 37.90 38.40
DAX
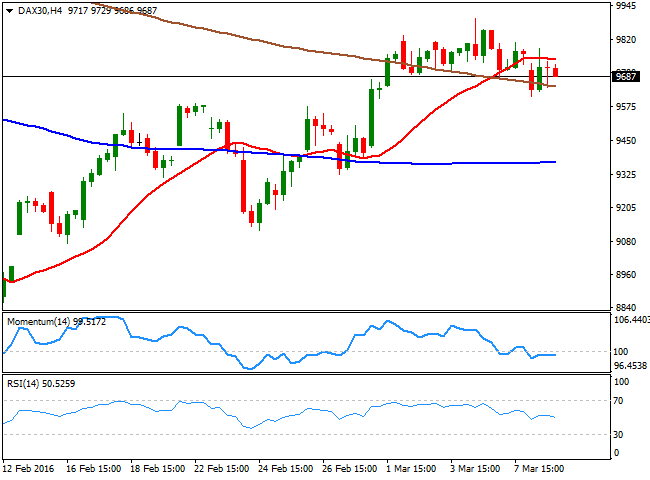
European equities were hit by risk aversion and increasingly poor earnings reports in the Union. As companies complete their fourth quarter announcements, it is clear that European companies have experienced their worst earnings season since the financial crisis in 2008. The German DAX fell 0.88% or 85 points, to close the day at 9.692.82, despite improved industrial production data. The index, however, managed to recover from a daily low around 9,613, although technical readings favor a downward continuation, given that the daily indicators have extended their retracement from overbought territory and maintain sharp bearish slopes. In the 4 hours chart, the technical picture also favors the downside, as the index has been contained by a mild bearish 20 SMA, currently around 9,750, whilst the technical indicators grind lower below their midlines, lacking momentum at the time being. A major support comes around the 9,570/80, where the pair has several daily highs and lows from earlier this year, and a break below it will likely signal a continued decline ahead of the ECB decision.
Support levels: 9,648 9,575 9,510
Resistance levels: 9,752 9,837 9,924
DOW JONES
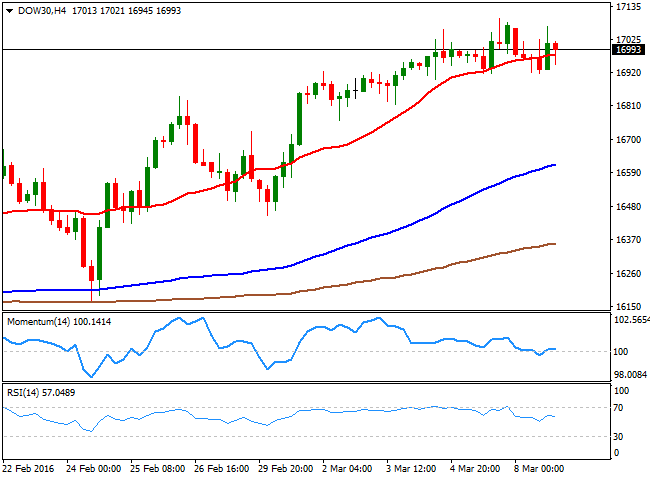
Worldwide stocks closed in the red this Tuesday, with Wall Street snapping a fiveday winning streak, weighed by renewed concerns over China's economic future and a retracement in oil prices. The Dow Jones Industrial Average closed at 16,964.10, down by 109 points, while the Nasdaq and the S and P shed over 1.0% each, closing at 4,548.83 and 1,979.26 respectively. The daily chart for the Dow Jones shows that buying interest surged on a test of the 100 DMA, at 16,915, but that the index is currently having some trouble to retain gains beyond the 200 DMA. The RSI indicator in the mentioned time frame heads slightly lower around 63, while the Momentum indicator also turned south within positive territory, although with limited downward strength. In the 4 hours chart, the technical picture is neutral, with the index hovering around a mild bullish 20 SMA, but the technical indicators lacking directional strength around their midlines. Much of the upcoming direction for US stocks will depend on whatever the US Federal Reserve decides next week, as if the Central Bank reaffirms its pledge to raise rates at least 3 to 4 times this year, stocks may turn long term bearish.
Support levels: 16,915 16,835 16,761
Resistance levels: 17,021 17,105 17,174
FTSE 100
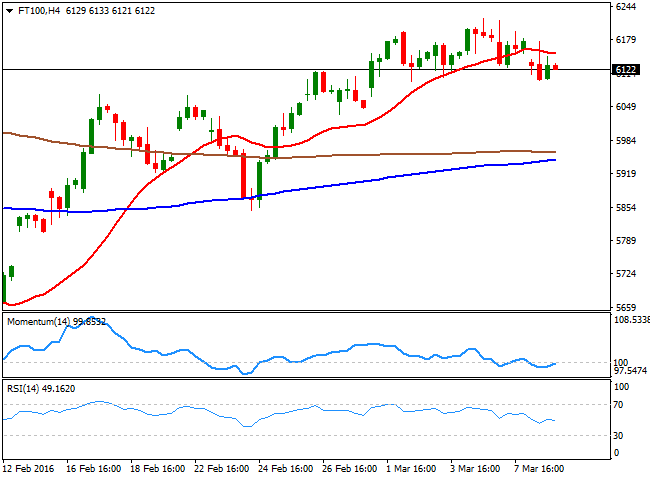
The Footsie shed 56 points or 0.92% to end the day at 6,125.44, with the mining sector down as China reported decreasing imports with its latest trade balance figures. Glencore suffered the most, down by 18% while Anglo American followed, shedding 15%. Oil related companies also edged lower, as the commodity gave back its Monday's gains, with BP ending 3.1% lower. From a technical point of view, there's an increasingly bearish tone, given that in the daily chart, the index is struggling to hold ground above its 100 SMA, whilst the technical indicators have accelerated further lower below their midlines. Shorter term, the 4 hours chart presents a neutral to bearish bias, as the 20 SMA is gaining bearish tone above the current level, whilst the RSI indicator is resuming its decline below 50, and the Momentum indicator heads nowhere around its midline. The index has several intraday lows around 6,100, meaning a break below it is required to confirm further declines for the upcoming sessions.
Support levels: 6,094 6,027 5,962
Resistance levels: 6,148 6,221 6,286
The information set forth herein was obtained from sources which we believe to be reliable, but its accuracy cannot be guaranteed. It is not intended to be an offer, or the solicitation of any offer, to buy or sell the products or instruments referred herein. Any person placing reliance on this commentary to undertake trading does so entirely at their own risk.
Recommended Content
Editors’ Picks
AUD/USD regains the constructive outlook above the 200-day SMA

AUD/USD advanced strongly for the second session in a row, this time extending the recovery to the upper 0.6500s and shifting its focus to the weekly highs in the 0.6580-0.6585 band, an area coincident with the 100-day SMA.
EUR/USD keeps the bullish performance above 1.0700

The continuation of the sell-off in the Greenback in the wake of the FOMC gathering helped EUR/USD extend its bounce off Wednesday’s lows near 1.0650, advancing past the 1.0700 hurdle ahead of the crucial release of US NFP on Friday.
Gold stuck around $2,300 as market players lack directional conviction

Gold extended its daily slide and dropped below $2,290 in the second half of the day on Thursday. The benchmark 10-year US Treasury bond yield erased its daily losses after US data, causing XAU/USD to stretch lower ahead of Friday's US jobs data.
Bitcoin price rises 5% as BlackRock anticipates a new wave of capital inflows into BTC ETFs from investors

Bitcoin (BTC) price slid to the depths of $56,552 on Wednesday as the cryptocurrency market tried to front run the Federal Open Market Committee (FOMC) meeting. The flash crash saw millions in positions get liquidated.
FOMC in the rear-view mirror – NFP eyed

The update from May’s FOMC rate announcement proved more dovish than expected, which naturally weighed on the US dollar (sending the DXY to lows of 105.44) and US yields, as well as, initially at least, underpinning major US equity indices.
