EUR/USD Price Forecast: Sellers maintain the pressure, lower lows in sight

EUR/USD Current price: 1.0763
- United States Treasury yields extend their advance, backing the US Dollar.
- The macroeconomic calendar remains scarce ahead of GDP readings next week.
- EUR/USD is oversold in the near term, but there are no signs of bearish exhaustion.
The EUR/USD pair extended its slide on Wednesday, trading near fresh multi-week lows in the 1.0770 region in the mid-European session. On the one hand, the US Dollar keeps rallying amid a dismal market mood and concerns about the outcome of the upcoming United States (US) Presidential election. On the other hand, the Euro suffers from poor local macroeconomic data that suggests the economic setback continues in the final quarter of the year.
Market players are vigilant of US Treasury yields’ behaviour, as bonds keep falling and yields reach multi-week highs. The 10-year note is currently offering 4.22%, while the 2-year note yields 4.04%.
A scarce macroeconomic calendar fuels the cautious mood ahead of next week’s figures. By the end of October, the Eurozone, Germany and the US will publish the preliminary estimates of their respective Q3 Gross Domestic Product (GDP), offering a clearer view of the state of these economies.
In the meantime, the EU is set to publish the preliminary estimate of October Consumer Confidence after Wall Street’s opening, while the US will release September Existing Home Sales. Additionally, a couple of Federal Reserve (Fed) officials will be on the wires, while European Central Bank President Christine Lagarde is due to speak about Europe's financial challenges at the Atlantic Council, in Washington DC.
EUR/USD short-term technical outlook
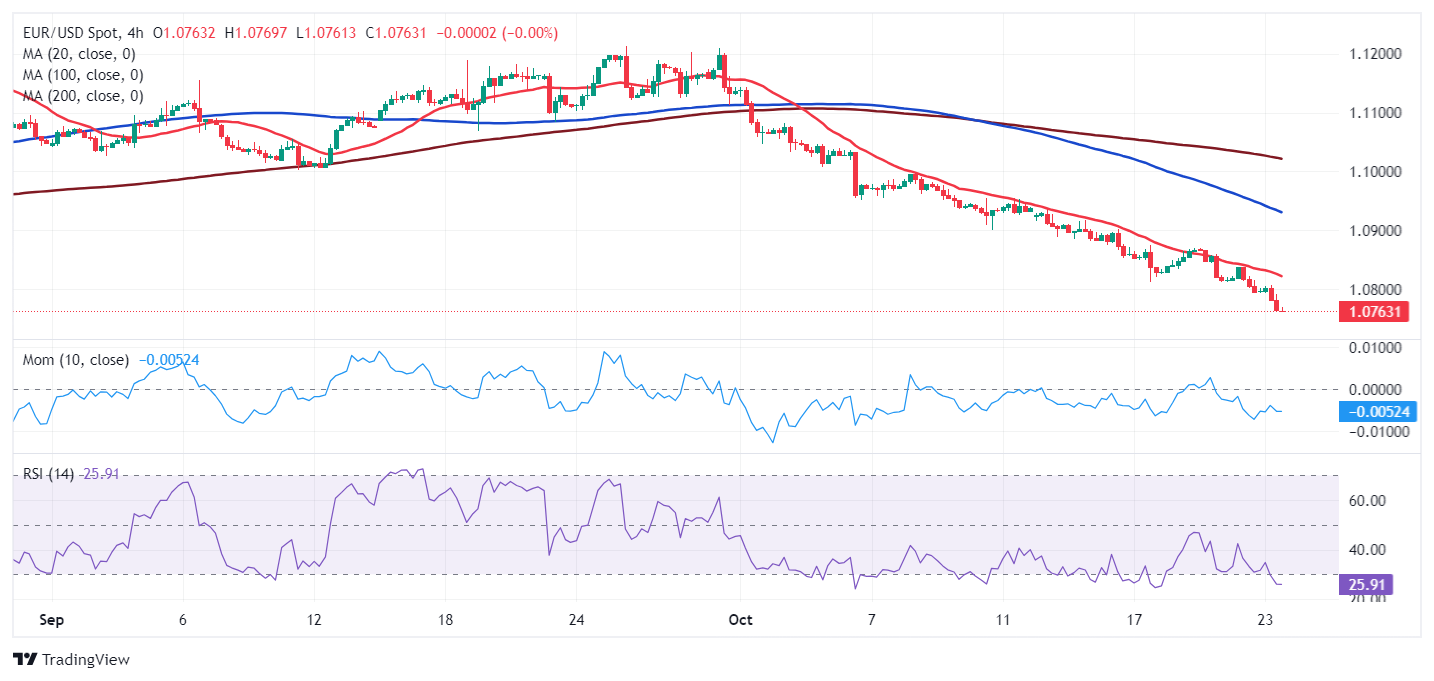
The daily chart for the EUR/USD pair shows it trades near its early low, without signs of downward exhaustion, despite the Relative Strength Index (RSI) indicator standing in oversold readings. The Momentum indicator also turned lower within negative levels, in line with persistent selling interest. Finally, the pair is developing below all its moving averages, with the 20 Simple Moving Average (SMA) heading south almost vertically and about to cross below a flat 100 SMA, the latter around 1.0920. A directionless 200 SMA provides dynamic resistance at around 1.0870.
In the near term, the risk also skews to the downside. In the 4-hour chart, technical indicators maintain their sharp downward slopes far below their current levels, although the RSI currently stands at around 23, hinting at a potential bullish correction coming up. At the same time, EUR/USD is trading well below bearish moving averages, which limits the upward potential should a correction finally develop. Near-term support can be found at around 1.0750, where the pair posted several intraday highs and lows in June and July.
Support levels: 1.0750 1.0710 1.0660
Resistance levels: 1.0800 1.0840 1.0885
Author

Valeria Bednarik
FXStreet
Valeria Bednarik was born and lives in Buenos Aires, Argentina. Her passion for math and numbers pushed her into studying economics in her younger years.


