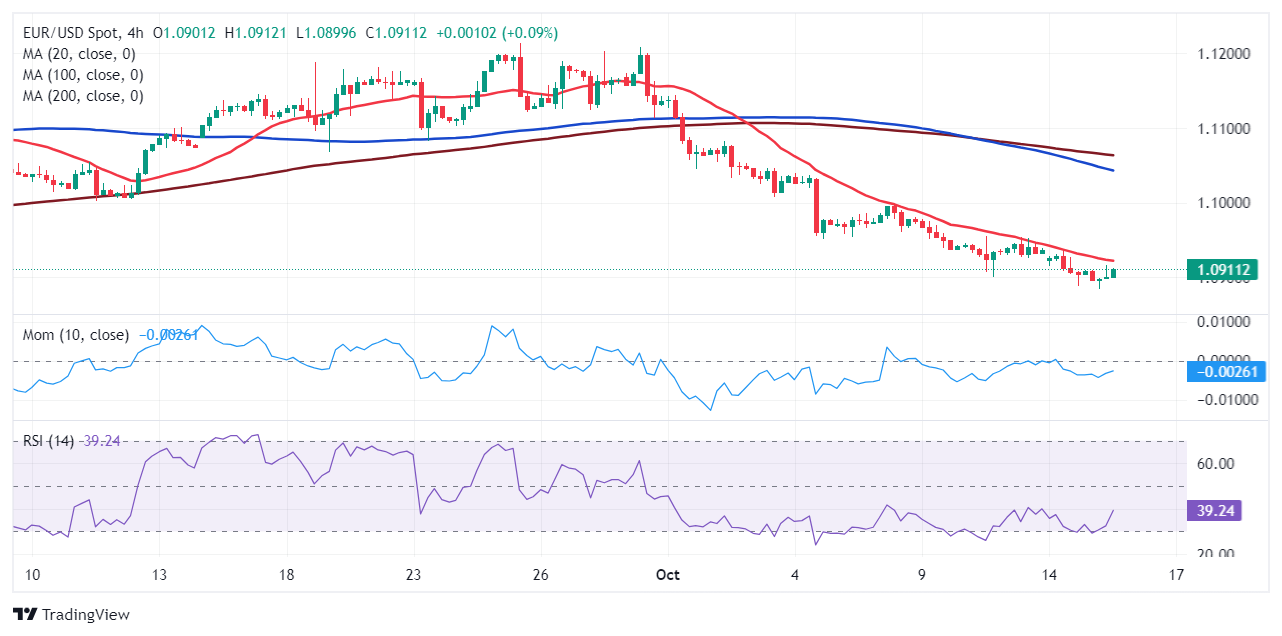
EUR/USD Current price: 1.0911
- The German ZEW Survey showed an unexpected improvement in Economic Sentiment.
- Wall Street struggles in the near term, but US indexes continue to post record highs.
- EUR/USD keeps posting lower lows, in line with the dominant bearish trend.
The EUR/USD pair fell battles to retain the 1.0900 mark on Tuesday after falling to a fresh two-month low of 1.0884. The US Dollar (USD) remained bid through the Asian session, but lost some ground after European trades reached their desks.
In the meantime, the Euro found near-term support in local data, as the German ZEW Survey showed that Economic Sentiment improved in the country and the Eurozone in October. The German index printed at 13.1, while the EU hit 20.1, much better than anticipated. However, the assessment of the current situation in the country contracted to -86.9 from -84.5 in September.
A better market mood also undermines demand for the USD. Wall Street rallied on Monday amid solid gains in the tech sector, pushing Asian and European indexes up throughout the first half of the day. However, easing oil prices weighs energy shares, putting mild pressure on European equities and United States (US) futures.
Ahead of the American opening, the US released the NY Empire State Manufacturing Index, which unexpectedly fell to -11.9 in October after rising by 11.5 in the previous month. Different Federal Reserve (Fed) officials will be on the wires later in the day.
EUR/USD short-term technical outlook
From a technical point of view, the EUR/USD pair is still poised to extend its slide. The daily chart shows it is trading around its opening but also that it posted a lower low and a lower high. Even further, EUR/USD develops below an almost flat 100 Simple Moving Average (SMA), providing dynamic resistance at around 1.0945. The 20 SMA, in the meantime, keeps gaining downward traction above the longer one, in line with persistent selling interest. Finally, technical indicators stand near oversold readings, without clear directional strength, but also without signs of downward exhaustion.
In the near term, and according to the 4-hour chart, EUR/USD is on its way to extending its slide. A bearish 20 SMA keeps rejecting buyers, while the 100 SMA accelerates below a bearish 200 SMA far above the current level. Technical indicators, in the meantime, consolidate within negative levels, failing to provide clear directional clues but still skewing the risk to the downside.
Support levels: 1.0885 1.0840 1.0805
Resistance levels: 1.0935 1.0970 1.1010
Information on these pages contains forward-looking statements that involve risks and uncertainties. Markets and instruments profiled on this page are for informational purposes only and should not in any way come across as a recommendation to buy or sell in these assets. You should do your own thorough research before making any investment decisions. FXStreet does not in any way guarantee that this information is free from mistakes, errors, or material misstatements. It also does not guarantee that this information is of a timely nature. Investing in Open Markets involves a great deal of risk, including the loss of all or a portion of your investment, as well as emotional distress. All risks, losses and costs associated with investing, including total loss of principal, are your responsibility. The views and opinions expressed in this article are those of the authors and do not necessarily reflect the official policy or position of FXStreet nor its advertisers. The author will not be held responsible for information that is found at the end of links posted on this page.
If not otherwise explicitly mentioned in the body of the article, at the time of writing, the author has no position in any stock mentioned in this article and no business relationship with any company mentioned. The author has not received compensation for writing this article, other than from FXStreet.
FXStreet and the author do not provide personalized recommendations. The author makes no representations as to the accuracy, completeness, or suitability of this information. FXStreet and the author will not be liable for any errors, omissions or any losses, injuries or damages arising from this information and its display or use. Errors and omissions excepted.
The author and FXStreet are not registered investment advisors and nothing in this article is intended to be investment advice.
Recommended Content
Editors’ Picks

AUD/USD: Further recovery targets 0.6400
AUD/USD soared to three-day highs around 0.6180 on Wednesday, bouncing back from multi-year lows near 0.5900 as easing worries over US tariffs helped fuel the recovery.

EUR/USD: Next on the upside comes the YTD peaks
EUR/USD ended the day with modest loses, coming under renewed downside pressure after hitting tops near 1.1100 the figure on the back of the late bounce in the Greenback.

Gold remains bid, refocuses on $3,100
Prices of Gold now regain some balance and approach the $3,100 zone per troy ounce on Wednesday after President Trump announced a 90-day pause on reciprocal and 10% tariffs. FOMC Minutes pointed to further caution from officials.

Bitcoin, crypto prices pump as Trump pauses tariffs for 90 days
Bitcoin (BTC) and several top cryptocurrencies rallied on Wednesday after President Donald Trump announced the United States (US) would pause its reciprocal tariff on 75 countries following their failure to retaliate and the opening of negotiations with key government agencies.

Tariff rollercoaster continues as China slapped with 104% levies
The reaction in currencies has not been as predictable. The clear winners so far remain the safe-haven Japanese yen and Swiss franc, no surprises there, while the euro has also emerged as a quasi-safe-haven given its high liquid status.

The Best brokers to trade EUR/USD
SPONSORED Discover the top brokers for trading EUR/USD in 2025. Our list features brokers with competitive spreads, fast execution, and powerful platforms. Whether you're a beginner or an expert, find the right partner to navigate the dynamic Forex market.