EUR/USD Forecast: Bears on hold ahead of US GDP, inflation data

EUR/USD Current price: 1.0664
- Upbeat European PMIs provided near-term support to the Euro.
- US S&P Global PMIs could set the tone during American trading hours.
- The EUR/USD has a limited bullish potential, can still pierce the 1.0600 threshold.
The EUR/USD pair gained some ground on Tuesday, peaking at 1.0694 during European trading hours. The pair eased from such a level, but retains modest gains and trade at around 1.0670. According to provisional survey data, the Euro benefited from upbeat local data, as the Hamburg Commercial Bank (HCOB) and S&P Global Purchasing Managers Indexes (PMIs) showed business activity in the euro area grew at the fastest rate for nearly a year in April.
Growth is modest but still brings hope as the seasonally adjusted EU Composite PMI Index rose from 50.3 in March to 51.4 in April. According to the official report, the German private sector also returned to growth at the start of the second quarter. The Composite PMI Index moved back above 50.0 for the first time in ten months in April, printing at 50.5 following 47.7 in March. In both economies, manufacturing remains the weakest leg, as it held in contraction territory.
S&P Global will release the preliminary estimates of the United States (US) PMIs after Wall Street’s opening, while the country will publish March New Home Sales and the April Richmond Fed Manufacturing Index.
Financial markets await first-tier US data, scheduled for later in the week. The country will release the preliminary estimate of the Q1 Gross Domestic Product on Thursday and the March Personal Consumption Expenditures (PCE) Price Index on Friday.
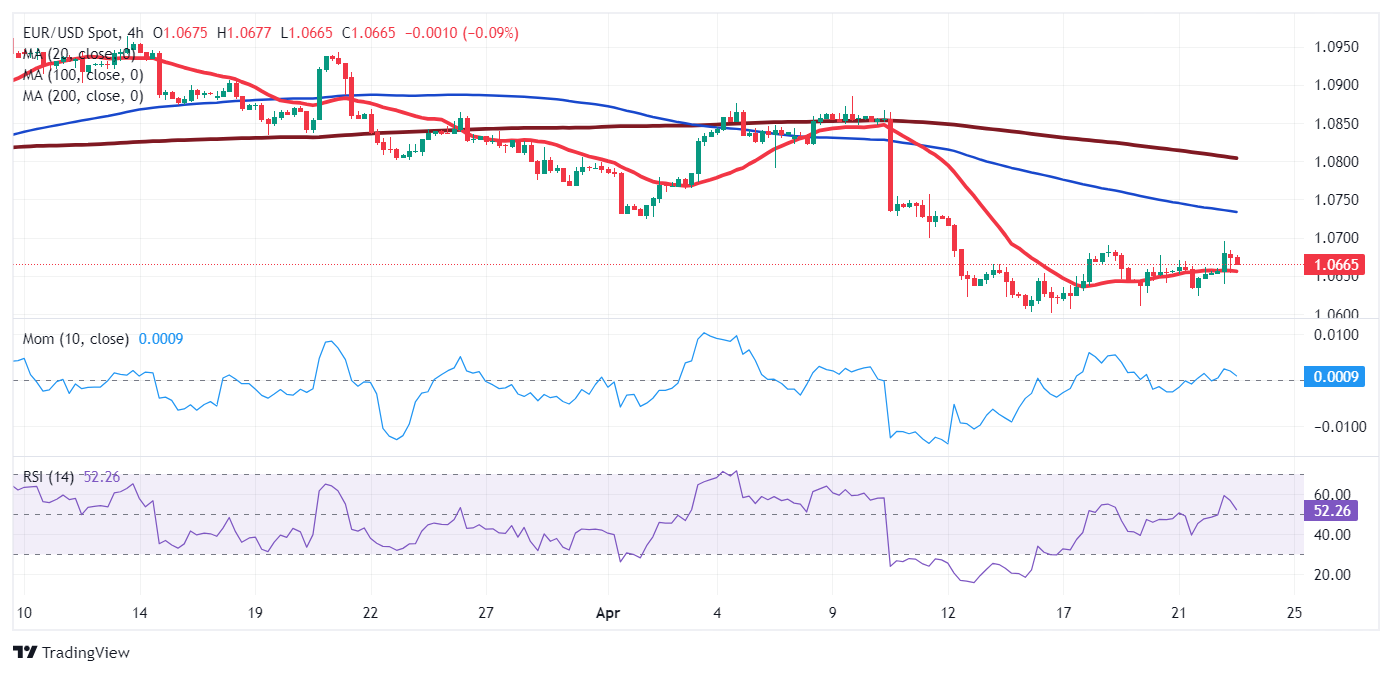
EUR/USD short-term technical outlook
The daily chart for EUR/USD shows the pair surpassed last week’s high by a few pips and adds ground for a third consecutive day. Nevertheless, the bullish potential remains limited. The Relative Strength Index (RSI) indicator stands directionless around 39, while the Momentum indicator turned south after failing to reconquer positive ground. Finally, the pair keeps developing below all its moving averages, with the 20 Simple Moving Average (SMA) heading firmly south and providing dynamic resistance at around 1.0740.
The 4-hour chart offers a neutral stance. Technical indicators head nowhere just above their midlines, losing the modest momentum seen earlier in the day. A flat 20 SMA provides near-term support at around 1.0650, while the 100 and 200 SMAs head firmly south, well above the current level. The pair bottomed for the year at 1.0600, the level to watch for a steeper bearish run.
Support levels: 1.0645 1.0600 1.0570
Resistance levels: 1.0700 1.0740 1.0745
Author

Valeria Bednarik
FXStreet
Valeria Bednarik was born and lives in Buenos Aires, Argentina. Her passion for math and numbers pushed her into studying economics in her younger years.


