Last week, Cable unfolded as expected and target was reached and exceeded. That indeed was a beautiful setup to watch unfolding.
This week Cable does not provide us with the same opportunity we had last week as this week`s opportunity is not as clear, however -as traders- we do not expect the market to be that clear all of the time. We gather clues and wait for the next ride.
We are updating the main count according to the latest price action and as well adding an alternate count which expects that Cable`s correction is incomplete.
As always we will wait for either count`s confirmation point to be reached to determine the highly probable count.
P.S.: I tried recording this week`s video analysis but as I am going through an acute case of Tonsillitis, my voice is barely audible and the audio quality was quite bad. Please accept my apologies for not publishing the video analysis this week.
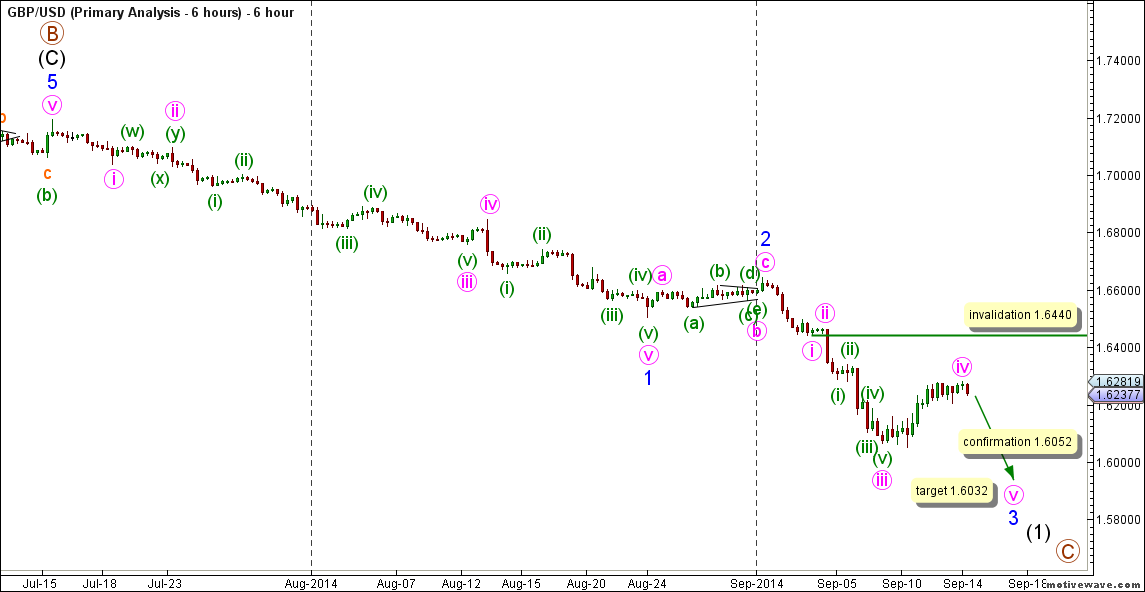
6-Hours Main Count
- Invalidation Point: 1.6440
- Confirmation Point: 1.6052
- Downwards Target: 1.6032
- Wave number: v pink
- Wave structure: Motive
- Wave pattern: Impulse/Ending diagonal
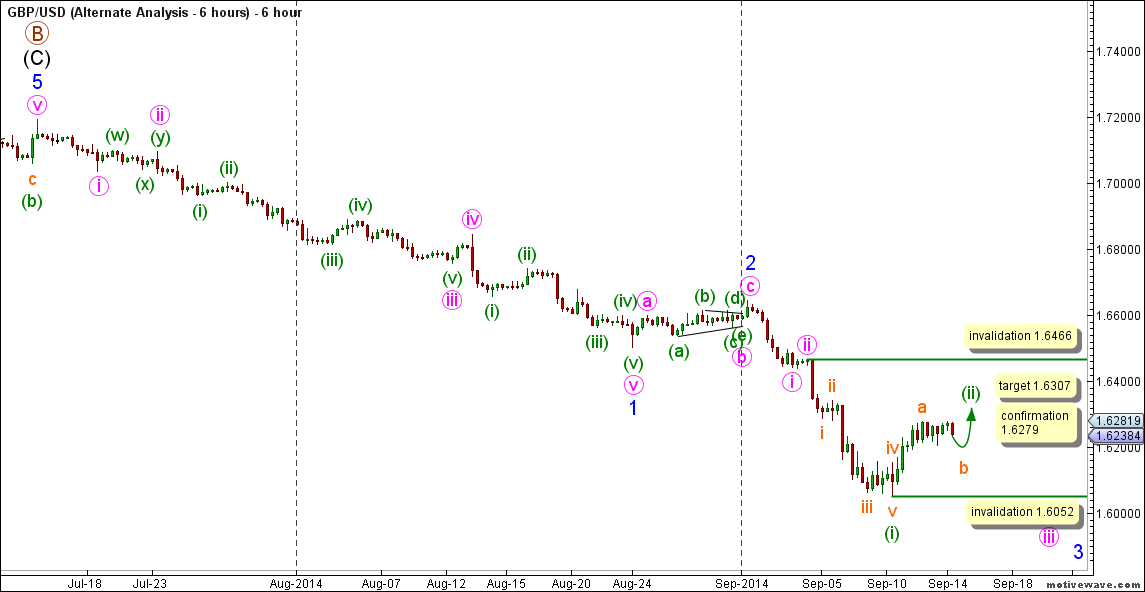
6-Hours Alternate Count
- Invalidation Point: 1.6466 -- 1.6052
- Confirmation Point: 1.6279
- Downwards Target: 1.6307
- Wave number: (ii) green
- Wave structure: Corrective
- Wave pattern: Zigzag
Main Wave Count
This count expects that wave B maroon is complete as a zigzag labeled waves (A), (B) and (C) black and that wave C maroon is starting to unfold towards the downside.
Wave (C) black within wave B maroon unfolded as an impulse labeled waves 1 through 5 blue.
Within wave C maroon wave (1) black is expected to be underway with waves 1 and 2 blue complete and that wave 3 blue is underway.
Wave 1 blue unfolded as an impulse labeled waves i through v pink.
Wave ii pink unfolded as a double combination labeled waves (w), (x) and (y) green.
Wave iii pink unfolded as an impulse labeled waves (i) through (v) green.
Wave v pink unfolded as an impulse labeled waves (i) through (v) green.
Wave 2 blue unfolded as a zigzag labeled waves a, b and c pink with wave b pink unfolding as a triangle labeled waves (a) through (e) green.
Within wave 3 blue waves i through iii pink are expected complete and as well it is expected that wave iv pink is likely complete and that wave v pink is starting to unfold towards the downside.
Wave iii pink unfolded as an impulse labeled waves (i) through (v) green.
This count would be confirmed by movement below 1.6052.
At 1.6032 wave v pink will reach 0.618 the length of wave iii pink.
This count would be invalidated by movement above 1.6440 as wave iv pink may not enter the price territory of wave i pink and it should be noted that the invalidation point will be moved to the end of wave iv pink once we have confirmation on the hourly chart that wave v pink is underway.
Alternate Wave Count
This count expects that wave iii pink is extending towards the downside with wave (i) green complete as an impulse labeled waves i through v orange and that wave (ii) green is at its late stages.
Within wave (ii) green wave a orange is expected complete and wave b orange is unfolding towards the downside, following the completion of wave b orange, wave c orange is expected to unfold towards the upside to complete wave (ii) green.
This count would be confirmed by movement above 1.6279.
At 1.6307 wave (ii) green will reach 0.618 the length of wave (i) green and we should pay extra attention to sign of trend exhaustion near that target level as that target represents the end of a corrective phase and the start of a powerful impulsive decline and we would not want to be caught on the wrong side of the trade.
This count would be invalidated by movement above 1.6466 as wave (ii) green may not retrace more than 100 % the length of wave (i) green and as well this count would be invalidated by movement below 1.6052 as wave b orange may not retrace more than 100 % the length of wave a orange.
Note: All information on this page is subject to change. The use of this website constitutes acceptance of our user agreement. Please read our privacy policy and legal disclaimer. Opinions expressed at FXstreet.com are those of the individual authors and do not necessarily represent the opinion of FXstreet.com or its management. Risk Disclosure: Trading foreign exchange on margin carries a high level of risk, and may not be suitable for all investors. The high degree of leverage can work against you as well as for you. Before deciding to invest in foreign exchange you should carefully consider your investment objectives, level of experience, and risk appetite. The possibility exists that you could sustain a loss of some or all of your initial investment and therefore you should not invest money that you cannot afford to lose. You should be aware of all the risks associated with foreign exchange trading, and seek advice from an independent financial advisor if you have any doubts.
Recommended Content
Editors’ Picks
AUD/USD regains the constructive outlook above the 200-day SMA

AUD/USD advanced strongly for the second session in a row, this time extending the recovery to the upper 0.6500s and shifting its focus to the weekly highs in the 0.6580-0.6585 band, an area coincident with the 100-day SMA.
EUR/USD keeps the bullish performance above 1.0700

The continuation of the sell-off in the Greenback in the wake of the FOMC gathering helped EUR/USD extend its bounce off Wednesday’s lows near 1.0650, advancing past the 1.0700 hurdle ahead of the crucial release of US NFP on Friday.
Gold stuck around $2,300 as market players lack directional conviction

Gold extended its daily slide and dropped below $2,290 in the second half of the day on Thursday. The benchmark 10-year US Treasury bond yield erased its daily losses after US data, causing XAU/USD to stretch lower ahead of Friday's US jobs data.
Bitcoin price rises 5% as BlackRock anticipates a new wave of capital inflows into BTC ETFs from investors

Bitcoin (BTC) price slid to the depths of $56,552 on Wednesday as the cryptocurrency market tried to front run the Federal Open Market Committee (FOMC) meeting. The flash crash saw millions in positions get liquidated.
FOMC in the rear-view mirror – NFP eyed

The update from May’s FOMC rate announcement proved more dovish than expected, which naturally weighed on the US dollar (sending the DXY to lows of 105.44) and US yields, as well as, initially at least, underpinning major US equity indices.

