EUR/USD Current Price: 1.1502
View Live Chart for the EUR/USD
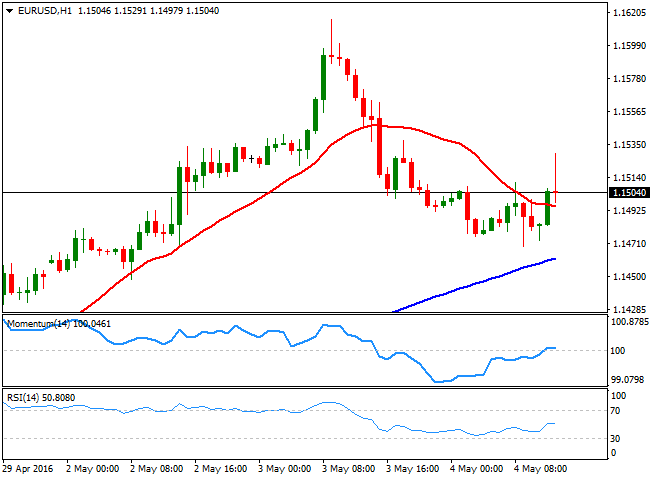
The EUR/USD pair extended its slide early Wednesday, down to 1.1469, pressured by soft Services PMIs in the region. But the pair recovered the 1.1500 level, and finally extend beyond it after the release of a worse-than-expected ADP survey in the US, showing that the private sector added only 156,000 new jobs in April, against 195,000 expected. March´s 200K was revised lower to 194K. Labor costs' previous numbers also suffered a sharp downward revision, whilst the preliminary reading for the first quarter of this year came in at 4.1%, much stronger than expected.
The EUR/USD pair stalled its recovery at 1.1529 and now struggles around the 1.1500 level, with quite a limited upward potential in the 1 hour chart, as the price is barely above its 20 SMA, whilst the technical indicators have quickly turned lower after recovering above their mid-lines, now presenting a neutral stance. In the 4 hours chart, the price is unable to clearly advance above a bullish 20 SMA, but the technical indicators have bounced modestly from their mid-lines, after completing a correction from extreme overbought territory. If the pair breaks below 1.1460, the pair may extend its decline further lower, down to 1.1380, although a recovery beyond 1.1530 should see it resuming its bullish trend.
Support levels: 1.1500 1.1460 1.1420
Resistance levels: 1.1530 1.1565 1.1615
GBP/USD Current price: 1.4527
View Live Chart for the GBP/USD
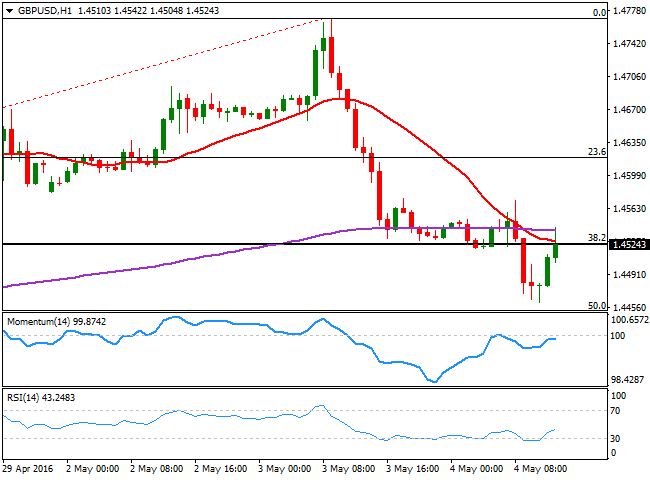
The British Pound plummeted to 1.4460 against the greenback following another disappointing macroeconomic figure in the UK, as the construction PMI fell to 52.00 in April, the weakest in almost three years as new business volumes stalled, according to the Markit report. The pair however, managed to bounce back, and spiked up to 1.4542 on poor US data, but in the 1 hour chart, further gains are not yet clear, given that the price retreated back below a bearish 20 SMA, whilst the technical indicators have lost bullish strength below their mid-lines. In the 4 hours chart, the 20 SMA presents a strong bearish slope far above the current level, while the technical indicators bounced modestly higher within bearish territory, far from supporting additional advances. The 50% retracement of the latest bullish run stands at 1.4450, the level to break to confirm a steeper decline during the upcoming hours.
Support levels: 1.4490 1.4450 1.4410
Resistance levels: 1.4585 1.4630 1.4680
USD/JPY Current price: 106.45
View Live Chart for the USD/JPY
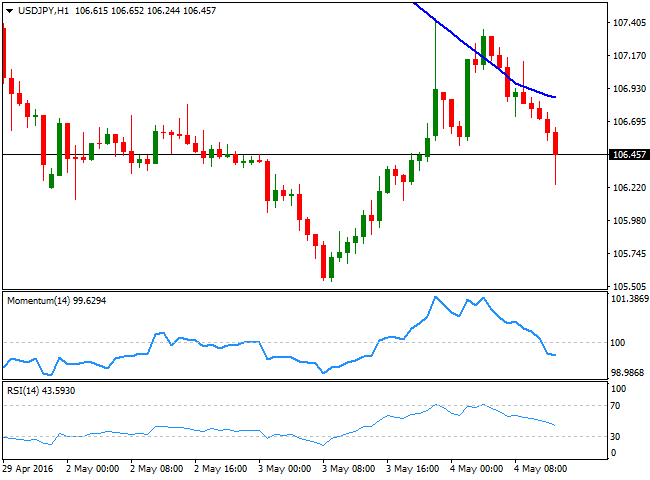
Correction complete, downward potential intact. The USD/JPY pair advanced up to 107.35 early Wednesday, but resumed its decline in the European morning, accelerating its slide after the release of the US ADP private employment survey, showing the world's largest economy added less jobs than expected during April. The pair was unable to advance beyond its 100 SMA in the hourly chart, suggesting the latest upward move has been merely corrective, and given that the technical indicators head south within negative territory, the risk remains towards the downside. Technical readings in the 4 hours chart have also turned lower after advancing up to their mid-lines, in line with the shorter term outlook. A break below the 106.00 level, however, is required to confirm further slides, down to the 105.00/20 region.
Support levels: 106.00 105.55 105.20
Resistance levels: 106.60 107.00 107.40
Information on these pages contains forward-looking statements that involve risks and uncertainties. Markets and instruments profiled on this page are for informational purposes only and should not in any way come across as a recommendation to buy or sell in these assets. You should do your own thorough research before making any investment decisions. FXStreet does not in any way guarantee that this information is free from mistakes, errors, or material misstatements. It also does not guarantee that this information is of a timely nature. Investing in Open Markets involves a great deal of risk, including the loss of all or a portion of your investment, as well as emotional distress. All risks, losses and costs associated with investing, including total loss of principal, are your responsibility. The views and opinions expressed in this article are those of the authors and do not necessarily reflect the official policy or position of FXStreet nor its advertisers. The author will not be held responsible for information that is found at the end of links posted on this page.
If not otherwise explicitly mentioned in the body of the article, at the time of writing, the author has no position in any stock mentioned in this article and no business relationship with any company mentioned. The author has not received compensation for writing this article, other than from FXStreet.
FXStreet and the author do not provide personalized recommendations. The author makes no representations as to the accuracy, completeness, or suitability of this information. FXStreet and the author will not be liable for any errors, omissions or any losses, injuries or damages arising from this information and its display or use. Errors and omissions excepted.
The author and FXStreet are not registered investment advisors and nothing in this article is intended to be investment advice.
Recommended Content
Editors’ Picks
AUD/USD: Gains appear capped near 0.6580

AUD/USD made a sharp U-turn on Tuesday, reversing six consecutive sessions of gains and tumbling to multi-day lows near 0.6480 on the back of the robust bounce in the Greenback.
EUR/USD tumbles out of recent range, tests below 1.0770 as markets flee into safe havens

EUR/USD slid below the 1.0670 level on Tuesday after an unexpected uptick in US wages growth reignited fears of sticky inflation, chopping down rate cut expectations and sending investors into safe haven bids.
Gold pullbacks on rising US yields, buoyant US Dollar as inflation heats up

Gold prices drop below the $2,300 threshold on Tuesday as data from the United States show that employment costs are rising, thus putting upward pressure on inflation. XAU/USD trades at $2,296 amid rising US Treasury bond yields and a stronger US Dollar.
Ethereum slumps again as long liquidations exceed those of Bitcoin

Ethereum experienced a further decline on Tuesday following a disappointing first-day trading volume for Hong Kong's spot Bitcoin and ETH ETFs. This comes off the back of increased long liquidations and mixed whale activity surrounding the top altcoin.
No tap dancing around inflation concerns

Tuesday saw U.S. stocks closing considerably lower as investors grappled with economic indicators indicating increasing labour costs and a decline in consumer confidence, all coming ahead of a crucial Fed policy meeting aimed at determining the trajectory of interest rates.