EUR/USD Current Price: 1.1157
View Live Chart for the EUR/USD
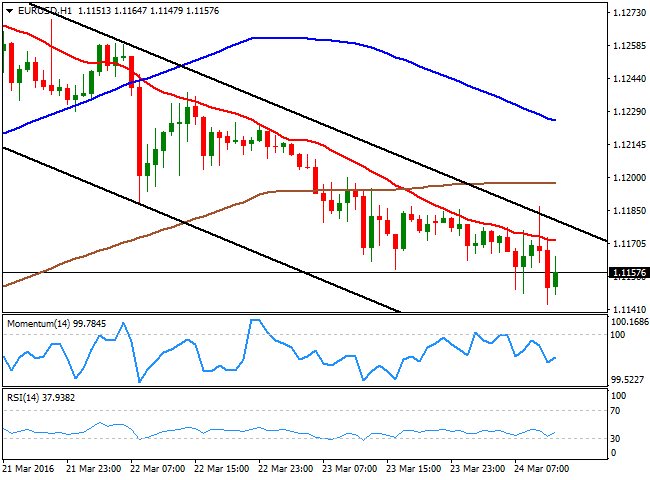
The dollar remained strong across the board during the first half of the day, although light volumes ahead of the Easter Holiday are quite notorious. The EUR/USD pair traded as low as 1.1143 and held nearby ahead of the release of US data, with US weekly unemployment claims coming in better-than-expected, at 265K for the week ending March 18th, but Durable Goods Orders for February with a slight disappointment, as the core reading fell more than expected, down by 1.0% while the headline reading fell 2.8% against a 2.9% decline forecasted. The greenback spiked lower after the news, but the reaction has been limited so far. The EUR/USD pair continues trading near its daily lows, and the 1 hour chart shows that selling interest has been surging on rallies towards a bearish 20 SMA, now around 1.1180. In the same chart, the technical indicators are posting tepid bounces within bearish territory, but lack strength. In the 4 hours chart, a bearish tone prevails, given that the price remains within the limits of the bearish channel and below a strongly bearish 20 SMA, whilst the technical indicators have barely bounced from near oversold territory, and remain far from suggesting additional gains.
Support levels: 1.1120 1.1085 1.1040
Resistance levels: 1.1080 1.1210 1.1245
GBP/USD Current price: 1.4124
View Live Chart for the GBP/USD
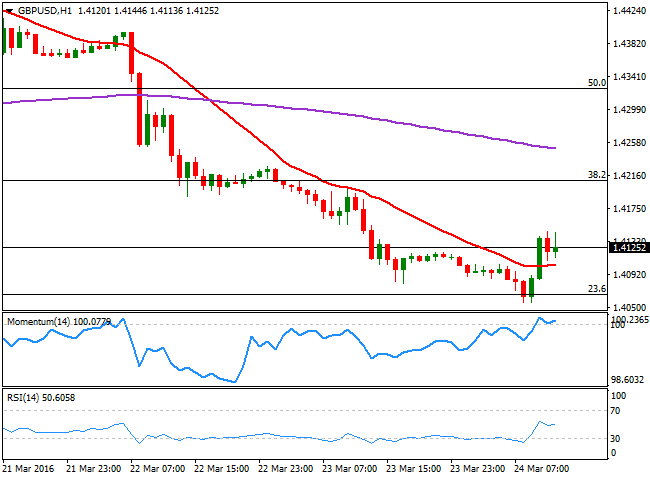
The GBP/USD pair bounced from a fresh weekly low of 1.4056, following better-than-expected retail sales figures, although sales declines in February by 0.4%, compared to a month before. Year-on-year, however, the trend remains strong, up 3.8%. The recovery extended up to 1.4146 ahead of the release of US data, which triggered a limited advance in the pair that was quickly erased. Overall, the risk remains towards the downside, albeit the decline seems overstretched and further upward corrective moves can't be disregarded. Technically, the 1 hour chart shows that the price recovered from around the 23.6% retracement of this year's decline, while the technical indicators are now aiming to advance above their mid-lines, as the price holds above a flat 20 SMA. In the 4 hours chart, the technical indicators have recovered partially from oversold levels, but remain well below their mid-lines and with shy upward slopes as the 20 SMA heads sharply lower around 1.4220, all of which should keep the upside limited.
Support levels: 1.4100 1.4050 1.4010
Resistance levels: 1.4160 1.4190 1.4225
USD/JPY Current price: 112.48
View Live Chart for the USD/JPY
Fading the rally from 113.00. The rally in the USD/JPY pair lost steam after London's opening, as local share markets opened sharply lower. The pair traded as high as 112.94 during the Asian session, in a lackluster fashion given the absence of macroeconomic data. US initial jobless claims came in better-than-expected, although Durable Goods Orders were far from signaling steady growth, declining in February 2.8% barely above the 2.9% decline expected. The pair accelerated its decline with the news, but seems the movement is being driven by falling equities rather than by US data. Technically, the 1 hour chart shows that the price is testing its 200 SMA, while the technical indicators have turned sharply lower and are currently crossing their mid-lines towards the downside, suggesting the decline may now extend. In the 4 hours chart, the price flirted with the 100 SMA around the mentioned rally before traders decide to fade the rally, indicating bears are still seeking for better opportunities.
Support levels: 112.10 111.70 111.30
Resistance levels: 112.95 113.30 113.75
AUD/USD Current price: 0.7538
View Live Chart for the AUD/USD
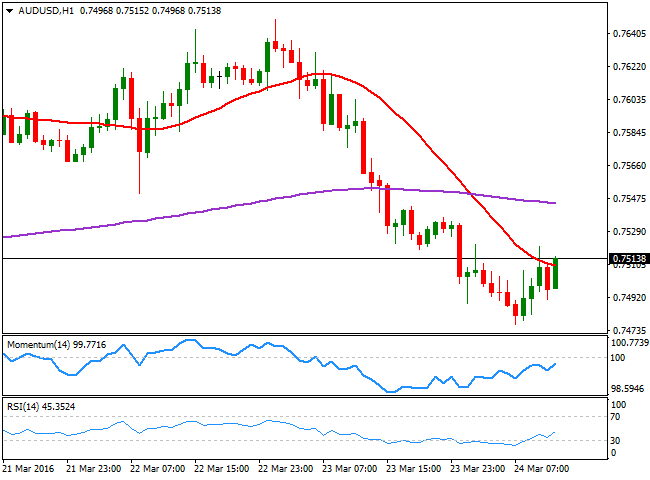
The AUD/USD pair remained under pressure early Thursday, weighed by the negative tone in commodities' prices. Gold extended its decline down to $ 1,212.46 a troy ounce, a fresh 3-week low. As for the pair, its currently recovering ahead of the US opening from a daily low of 0.7476, although further gains are not yet confirmed, given that the price is currently struggling to advance above its 20 SMA, while the technical indicators head higher, but below their mid-lines. In the 4 hours chart, the 20 SMA has turned lower well above the current level, while the technical indicators have bounced from oversold readings, but still lack strength enough to confirm a continued advance.
Support levels: 0.7470 0.7440 0.7400
Resistance levels: 0.7550 0.7605 0.7640
Information on these pages contains forward-looking statements that involve risks and uncertainties. Markets and instruments profiled on this page are for informational purposes only and should not in any way come across as a recommendation to buy or sell in these assets. You should do your own thorough research before making any investment decisions. FXStreet does not in any way guarantee that this information is free from mistakes, errors, or material misstatements. It also does not guarantee that this information is of a timely nature. Investing in Open Markets involves a great deal of risk, including the loss of all or a portion of your investment, as well as emotional distress. All risks, losses and costs associated with investing, including total loss of principal, are your responsibility. The views and opinions expressed in this article are those of the authors and do not necessarily reflect the official policy or position of FXStreet nor its advertisers. The author will not be held responsible for information that is found at the end of links posted on this page.
If not otherwise explicitly mentioned in the body of the article, at the time of writing, the author has no position in any stock mentioned in this article and no business relationship with any company mentioned. The author has not received compensation for writing this article, other than from FXStreet.
FXStreet and the author do not provide personalized recommendations. The author makes no representations as to the accuracy, completeness, or suitability of this information. FXStreet and the author will not be liable for any errors, omissions or any losses, injuries or damages arising from this information and its display or use. Errors and omissions excepted.
The author and FXStreet are not registered investment advisors and nothing in this article is intended to be investment advice.
Recommended Content
Editors’ Picks
AUD/USD post moderate gains on solid US data, weak Aussie PMI

The Australian Dollar registered solid gains of 0.65% against the US Dollar on Thursday, courtesy of an upbeat market mood amid solid economic data from the United States. However, the Federal Reserve’s latest monetary policy decision is still weighing on the Greenback. The AUD/USD trades at 0.6567.
EUR/USD recovers to top end of consolidation ahead of Friday’s US NFP

EUR/USD drove back to the top end of recent consolidation on Thursday, recovering chart territory north of the 1.0700 handle as market risk appetite regains balance heading into another US Nonfarm Payrolls Friday.
Gold recoils on hawkish Fed moves, unfazed by dropping yields and softer US Dollar

Gold price clings to the $2,300 figure in the mid-North American session on Thursday amid an upbeat market sentiment, falling US Treasury yields, and a softer US Dollar. Traders are still digesting Wednesday’s Federal Reserve decision to hold rates unchanged.
High hopes rouse for TON coin with Pantera as its latest investor

Ton blockchain could see more growth in the coming months after investment firm Pantera Capital announced a recent investment in the Layer-one blockchain, as disclosed in a blog post on Thursday.
NFP: The ultimate litmus test for doves vs. hawks

US Nonfarm Payrolls will undoubtedly be the focal point of upcoming data releases. The estimated figure stands at 241k, notably lower than the robust 303k reported in the previous release and below all other readings recorded this year.


