EUR/USD Current Price: 1.0891
View Live Chart for the EUR/USD
The common currency met some demand this Monday, helped by tepid US data and falling oil prices. The day started with the release of the Chinese official manufacturing PMI down to 49.4 in January from 49.7 in December. The Caixin Manufacturing PMI also signaled a modest deterioration in operating conditions at beginning of 2016, with both output and employment declining at slightly faster rates than in December, and resulting at 48.4 in January. In fact, and with the exception of the UK one, all manufacturing PMIs, showed that growth decelerated at the beginning of the year, as the German reading resulted at 52.3 against the 52.1 expected and below the 53.2 final December reading. The EU figure matched expectations at 52.3, also below the 53.2 printed in December. In the US, personal income surged by 0.3% in December, but consumption lacked, as spending was flat during December. The US manufacturing ISM for January was weaker-than-expected at 48.2, suggesting Friday's payrolls can be a miss, given that the employment component fell.
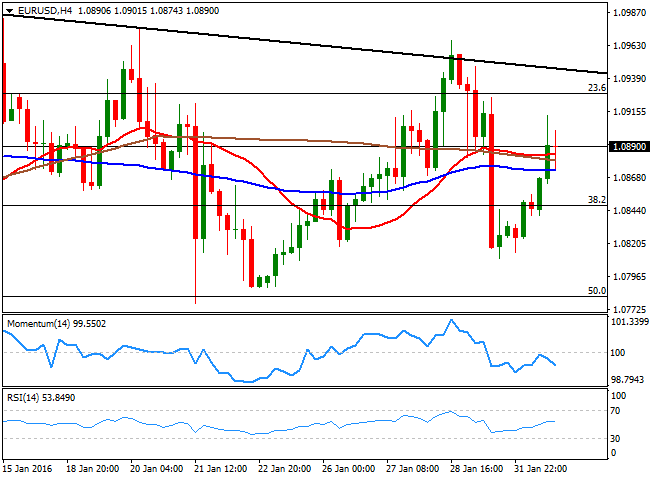
The EUR/USD pair traded as high as 1.0912, as oil prices were under pressure ever since London opening, down towards $31.00 a barrel by the end of the US session. Nevertheless, the common currency was unable to gather enough momentum to rally, once again, meeting selling interest near the top of its range. Holding into gains, the pair trades below the 1.0900 level and the 4 hours chart shows that the price is a handful of pips above its moving averages that anyway remain flat and in a tight range. In the same chart, the Momentum indicator heads lower after failing to overcome its mid-line, while the RSI lacks directional strength around 54.
Support levels: 1.0845 1.0810 1.0770
Resistance levels: 1.0925 1.0960 1.1000
EUR/JPY Current price: 131.80
View Live Chart for the EUR/JPY
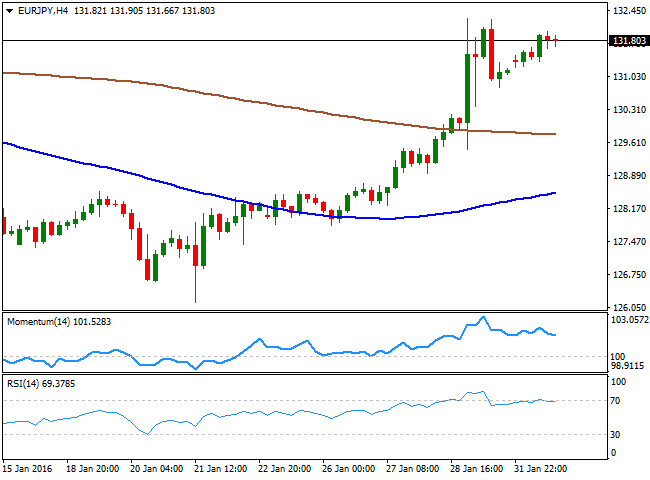
The EUR/JPY advanced on the back of EUR's recovery, but remained below Friday's high. The pair is a critical level according to the daily chart, as the price is pressuring its 100 DMA, first time around it since mid December. A steady recovery above the level can signal a midterm upward continuation towards the 200 DMA currently at 134.10. Shorter term, the 1 hour chart shows that the price has moved slowly higher, leaving indicators flat within positive territory, but well above the 100 and 200 SMAs, with the shortest now around 130.10. In the 4 hours chart, the technical indicators are pulling slightly lower from overbought territory, but are far from suggesting a bearish move, as the price holds near its daily high of 131.99.
Support levels: 131.60 131.10 131.55
Resistance levels: 132.00 132.45 132.90
GBP/USD Current price: 1.4383
View Live Chart for the GBP/USD
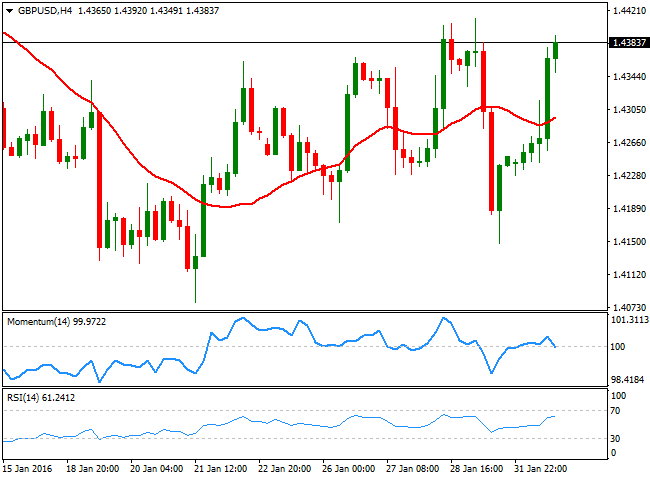
The British Pound outperformed its majors peers, having climbed to fresh daily highs against the dollar during the New York session. In spite of oil's decline, the GBP found support on a modest growth improvement in the UK as the Markit Manufacturing PMI for January reached a fresh 3-month high of 52.9, up from December's 52.1. The pair retraced most of its Friday's losses, but lacked momentum to retest the 1.4400 area. Short term, the 1 hour chart shows that the technical indicators are losing upward strength, but hold within overbought territory, as the price remains near its daily high and far above a bullish 20 SMA, all of which supports some further advances. In the 4 hours chart, the price is steady above its 20 SMA, while the RSI indicator heads higher around 61, but the Momentum indicator lacks upward strength, and if fact turned lower around its 100 level. The pair established a high at 1.4412 last week, so it will take an acceleration beyond it to confirm additional gains towards the 1.4500 figure.
Support levels: 1.4360 1.4315 1.4270
Resistance levels: 1.4420 1.4460 1.4500
USD/JPY Current price: 121.12
View Live Chart for the USD/JPY
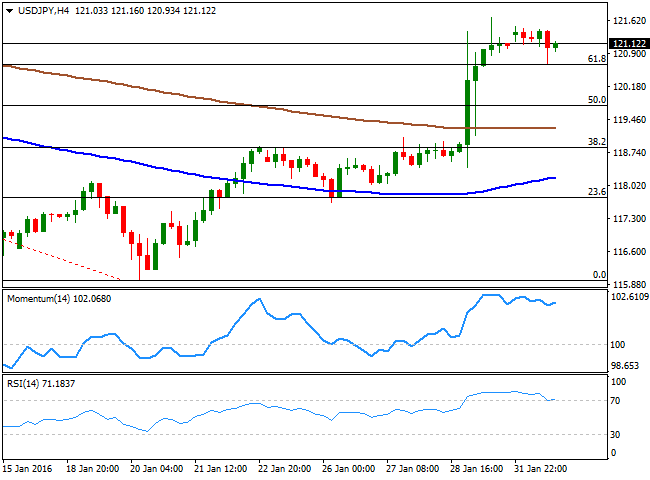
The USD/JPY pair showed little signs of life this Monday, falling down to 120.67 after the release of poor US data, but quickly recovering above the 121.00 level, ending the day around Friday's close. The daily chart shows that the pair remained trapped between its 100 DMA, offering support around the mentioned low, and the 200 DMA, at 121.50, maintaining the latest bullish trend in place. Shorter term the 1 hour chart shows that the technical indicators are horizontal within neutral territory, but the price remains well above its moving averages. In the 4 hours chart, the technical indicators have corrected partially extreme overbought readings, but are aiming back higher, whilst the price is above the 61.8% retracement of its latest bearish run at 120.60. As long as this last level holds, the downside will remain limited, albeit an advance above 121.70, last week high is required to confirm further gains for this Tuesday.
Support levels: 121.00 120.60 120.15
Resistance levels: 121.70 122.10 122.40
AUD/USD Current price: 0.7085
View Live Chart for the AUD/USD
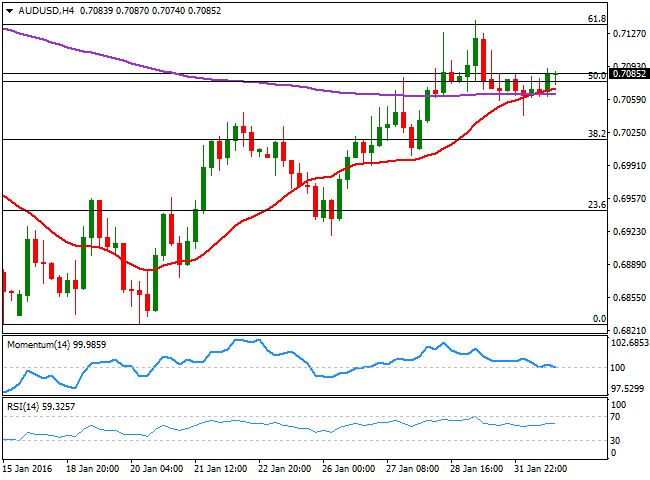
The AUD/USD pair trades slightly higher this Monday, with commodity-related currencies ignoring for once, the decline in crude oil prices, and gaining on the back of broad dollar's weakness. The Reserve Bank of Australia will have its economic policy meeting at the beginning of the Asian session, and is largely expected to leave its benchmark interest rate unchanged and to sound relatively dovish, in line with the easing bias showed by other Central Banks. The pair has a mild positive tone in the short term, as the price is currently advancing above a horizontal 20 SMA and the 50% retracement of the latest bearish run, while the technical indicators lack directional strength, but hold above their mid-lines. In the 4 hours chart, the price managed to hold above its 200 EMA and a bullish 20 SMA, both around 0.7060, but the technical indicators also head nowhere, with the Momentum indicator around its 100 level and the RSI at 59. A break below the mentioned 200 EMA could see the pair extending its decline down to 0.7020, while below this last, the bearish tone is expected to accelerate in the short term pass the 0.7000 figure.
Support levels: 0.7060 0.7020 0.6980
Resistance levels: 0.7105 0.7150 0.7190
Information on these pages contains forward-looking statements that involve risks and uncertainties. Markets and instruments profiled on this page are for informational purposes only and should not in any way come across as a recommendation to buy or sell in these assets. You should do your own thorough research before making any investment decisions. FXStreet does not in any way guarantee that this information is free from mistakes, errors, or material misstatements. It also does not guarantee that this information is of a timely nature. Investing in Open Markets involves a great deal of risk, including the loss of all or a portion of your investment, as well as emotional distress. All risks, losses and costs associated with investing, including total loss of principal, are your responsibility. The views and opinions expressed in this article are those of the authors and do not necessarily reflect the official policy or position of FXStreet nor its advertisers. The author will not be held responsible for information that is found at the end of links posted on this page.
If not otherwise explicitly mentioned in the body of the article, at the time of writing, the author has no position in any stock mentioned in this article and no business relationship with any company mentioned. The author has not received compensation for writing this article, other than from FXStreet.
FXStreet and the author do not provide personalized recommendations. The author makes no representations as to the accuracy, completeness, or suitability of this information. FXStreet and the author will not be liable for any errors, omissions or any losses, injuries or damages arising from this information and its display or use. Errors and omissions excepted.
The author and FXStreet are not registered investment advisors and nothing in this article is intended to be investment advice.
Recommended Content
Editors’ Picks
EUR/USD clings to gains above 1.0750 after US data

EUR/USD manages to hold in positive territory above 1.0750 despite retreating from the fresh multi-week high it set above 1.0800 earlier in the day. The US Dollar struggles to find demand following the weaker-than-expected NFP data.
GBP/USD declines below 1.2550 following NFP-inspired upsurge

GBP/USD struggles to preserve its bullish momentum and trades below 1.2550 in the American session. Earlier in the day, the disappointing April jobs report from the US triggered a USD selloff and allowed the pair to reach multi-week highs above 1.2600.
Gold struggles to hold above $2,300 despite falling US yields

Gold stays on the back foot below $2,300 in the American session on Friday. The benchmark 10-year US Treasury bond yield stays in negative territory below 4.6% after weak US data but the improving risk mood doesn't allow XAU/USD to gain traction.
Bitcoin Weekly Forecast: Should you buy BTC here? Premium

Bitcoin (BTC) price shows signs of a potential reversal but lacks confirmation, which has divided the investor community into two – those who are buying the dips and those who are expecting a further correction.
Week ahead – BoE and RBA decisions headline a calm week

Bank of England meets on Thursday, unlikely to signal rate cuts. Reserve Bank of Australia could maintain a higher-for-longer stance. Elsewhere, Bank of Japan releases summary of opinions.
