EUR/USD Current Price: 1.0898
View Live Chart for the EUR/USD
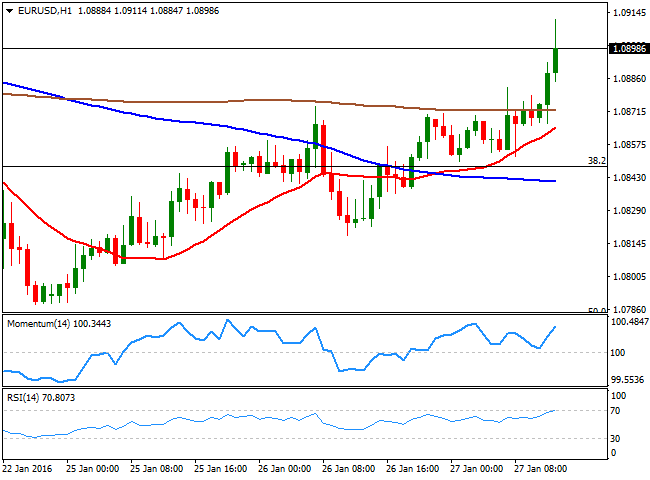
The American dollar trades generally lower against its major rivals, in anticipation of a dovish stance from the US Central Bank, which will announce its latest economic policy decision in the US afternoon. The EUR/USD pair advanced beyond the 38.2% retracement of its December rally at 1.0845 during Asian hours, and found support in the level during the European morning, and is currently trading near its daily high of 1.0911. In Germany, the GFK consumer confidence survey came out better-than-expected, at 9.4, matching previous month result, underpinning the common currency. After Wall Street opening, the US will release the New Home Sales data for December, but investors will likely remain side-lines ahead of the FOMC statement later in the day. Current greenback weakness, is also due to investors pricing in a dovish stance, as no news are expected from the FED, beside the acknowledgment of Chinese woes.
Technically and for the short term, the 1 hour chart for the EUR/USD pair supports some further advances, as the technical indicators hover within positive territory, lacking momentum, but that the price has broken above its moving averages. in the 4 hours chart, the technical indicators present bullish slopes above their mid-lines, while the price is above its 20 SMA, supporting the shorter term view.
Support levels: 1.0845 1.0810 1.0770
Resistance levels: 1.0925 1.0960 1.1000
GBP/USD Current price: 1.4334
View Live Chart for the GBP/USD
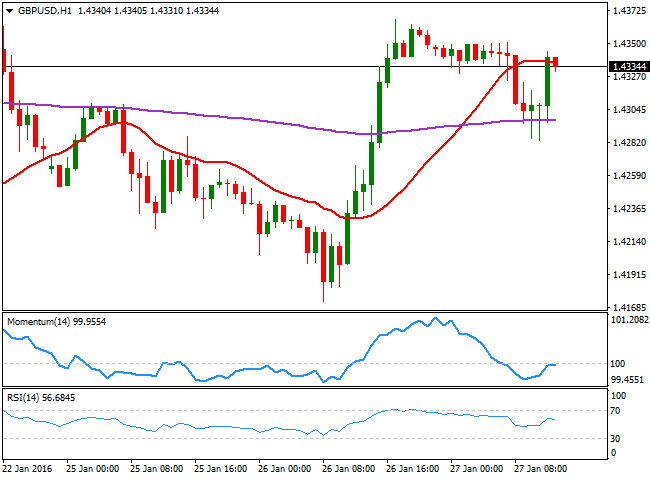
The GBP/USD pair trades around its daily opening, having been unable to rally beyond the 1.4360 region, last week and this week highs. The short term picture shows that the upside is still limited, given that in the 1 hour chart, the price is unable to advance beyond its 20 SMA, while the technical indicators head lower around their mid-lines. In the 4 hours chart, however, buyers have surged around a mild bullish 20 SMA, now around 1.4285, while the Momentum indicator has bounced from its mid-line, and the RSI indicator heads higher around 56. The pair needs an upward correction after shedding over 850 pips during the last 4 weeks, but the movement is still uncertain, and there are no confirmation still that an interim bottom has been reached. Should the pair end the day above 1.4400, the upside will look more constructive for the rest of the week.
Support levels: 1.4285 1.4250 1.4220
Resistance levels: 1.4365 1.4400 1.4440
USD/JPY Current price: 118.34
View Live Chart for the USD/JPY
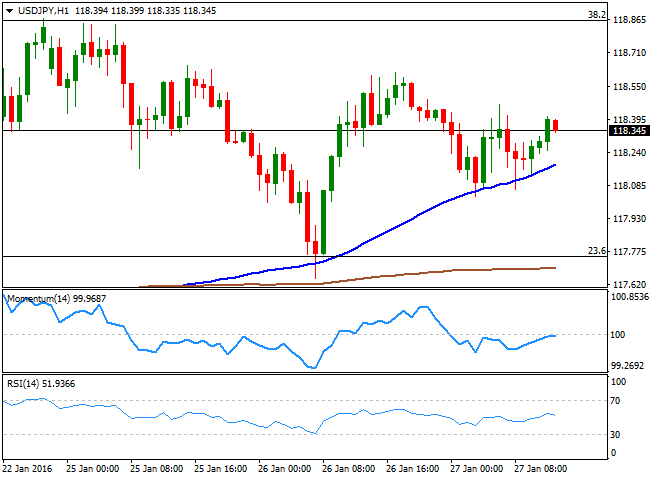
Directionless ahead of the FOMC. The USD/JPY remains in wait-and-see mode ahead of the US FOMC announcement later in the American afternoon, having traded in a 20 pips range ever since the day started. The pair presents a slightly positive tone, as in the 1 hour chart, the price is holding above a bullish 100 SMA, while further above the 200 SMA, and as the technical indicators head north, crossing their mid-lines towards the upside. In the 4 hours chart, the price is above is 100 SMA but the technical indicators lack enough upward momentum to confirm further gains. The key resistance remains at 118.90, the 38.2% retracement of the latest bearish run and last Friday high, as it will take a break above it to confirm further gains. Below 118.15 however, the risk will turn towards the downside, with 117.30 as a probable bearish target for the day.
Support levels: 118.15 117.70 117.30
Resistance levels: 118.90 119.35 119.70
AUD/USD Current price: 0.7059
View Live Chart for the AUD/USD
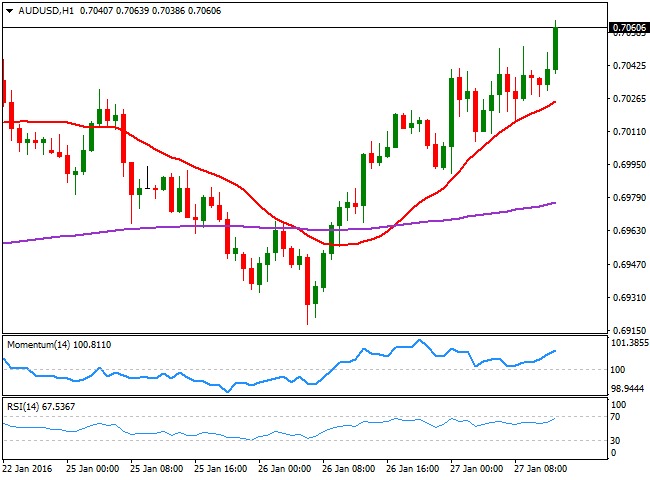
The Aussie trades at its highest in three weeks, helped by better-than-expected Australian inflation figures in the Q4 of 2015. The pair presents a short term bullish tone, given that the price accelerates above a bullish 20 SMA, while the technical indicators head sharply higher above their mid-lines. In the 4 hours chart, the price is above a bullish 20 SMA while the technical also head north above their midlines in line with further gains. The pair is pressuring its 200 EMA, still capping the upside in the 0.7065 region, and a break above it should lead to some a steadier recovery in the commodity related currency, particularly if the greenback remains week.
Support levels: 0.7040 0.7000 0.6960
Resistance levels: 0.7065 0.7110 0.7150
Information on these pages contains forward-looking statements that involve risks and uncertainties. Markets and instruments profiled on this page are for informational purposes only and should not in any way come across as a recommendation to buy or sell in these assets. You should do your own thorough research before making any investment decisions. FXStreet does not in any way guarantee that this information is free from mistakes, errors, or material misstatements. It also does not guarantee that this information is of a timely nature. Investing in Open Markets involves a great deal of risk, including the loss of all or a portion of your investment, as well as emotional distress. All risks, losses and costs associated with investing, including total loss of principal, are your responsibility. The views and opinions expressed in this article are those of the authors and do not necessarily reflect the official policy or position of FXStreet nor its advertisers. The author will not be held responsible for information that is found at the end of links posted on this page.
If not otherwise explicitly mentioned in the body of the article, at the time of writing, the author has no position in any stock mentioned in this article and no business relationship with any company mentioned. The author has not received compensation for writing this article, other than from FXStreet.
FXStreet and the author do not provide personalized recommendations. The author makes no representations as to the accuracy, completeness, or suitability of this information. FXStreet and the author will not be liable for any errors, omissions or any losses, injuries or damages arising from this information and its display or use. Errors and omissions excepted.
The author and FXStreet are not registered investment advisors and nothing in this article is intended to be investment advice.
Recommended Content
Editors’ Picks
EUR/USD clings to gains above 1.0750 after US data

EUR/USD manages to hold in positive territory above 1.0750 despite retreating from the fresh multi-week high it set above 1.0800 earlier in the day. The US Dollar struggles to find demand following the weaker-than-expected NFP data.
GBP/USD declines below 1.2550 following NFP-inspired upsurge

GBP/USD struggles to preserve its bullish momentum and trades below 1.2550 in the American session. Earlier in the day, the disappointing April jobs report from the US triggered a USD selloff and allowed the pair to reach multi-week highs above 1.2600.
Gold struggles to hold above $2,300 despite falling US yields

Gold stays on the back foot below $2,300 in the American session on Friday. The benchmark 10-year US Treasury bond yield stays in negative territory below 4.6% after weak US data but the improving risk mood doesn't allow XAU/USD to gain traction.
Bitcoin Weekly Forecast: Should you buy BTC here? Premium

Bitcoin (BTC) price shows signs of a potential reversal but lacks confirmation, which has divided the investor community into two – those who are buying the dips and those who are expecting a further correction.
Week ahead – BoE and RBA decisions headline a calm week

Bank of England meets on Thursday, unlikely to signal rate cuts. Reserve Bank of Australia could maintain a higher-for-longer stance. Elsewhere, Bank of Japan releases summary of opinions.


