EUR/USD Current price: 1.0614
View Live Chart for the EUR/USD
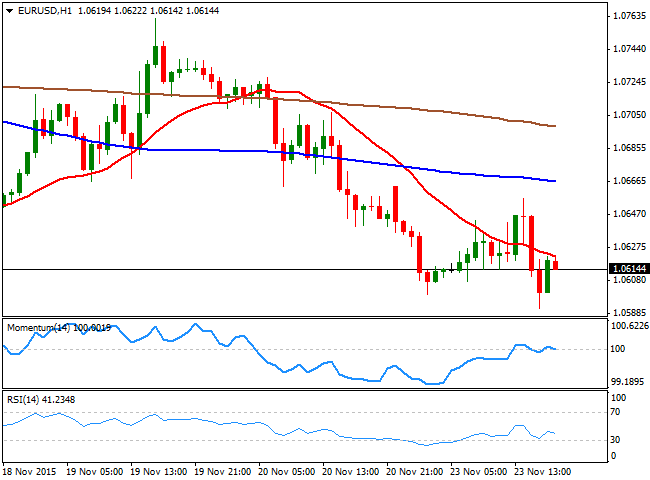
Dollar's rally against the common currency extended to a fresh 7-month high this Monday, as the EUR/USD pair traded as low as 1.0591 in the American afternoon, despite disappointing US data, and positive European one. Earlier in the day, the Markit PMI readings in Europe showed that the region grew at its fastest rate in over four years, with the service sector leading the recovery. In the US, however, the manufacturing sector suffered a setback in November, as the flash Markit PMI fell to 52.6 from the previous 54.1, while Existing home sales fell 3.4% in October to a 5.36 million-unit annual pace.The EUR/USD pair however, maintained the dominant bearish tone, having closed in the red a few pips above the 1.0600 figure, and with the 1 hour chart showing that the price is being contained by a bearish 20 SMA, whilst the Momentum indicator is hovering around its 100 level and the RSI indicator turned back south after a limited upward correction. In the 4 hours chart, the price has extended its decline further below a flat 20 SMA, while the Momentum indicator maintains a strong bearish slope below its 100 level, while the RSI remains around 35, in line with further declines for this Tuesday.
Support levels: 1.0590 1.0550 1.0510
Resistance levels: 1.0650 1.0690 1.0730
EUR/JPY Current price: 130.40
View Live Chart for the EUR/JPY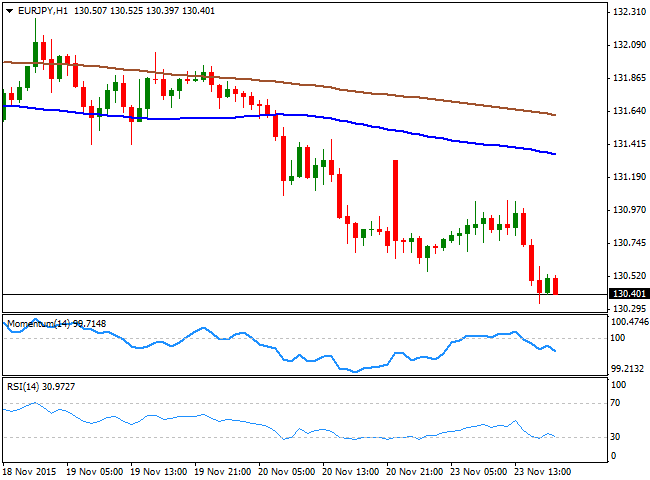
The EUR/JPY pair continues trading accordingly with EUR's self strength or weakness, having extended its decline down to 130.33 this Monday. The pair is falling for a seventh week in-a-row, and although the bearish momentum seems to be easing, there is no sign that the ongoing trend is exhausted and will soon reverse. Short term, the 1 hour chart shows that the 100 and 200 SMAs continue heading lower well above the current level, whilst the technical indicators present strong bearish slopes below their mid-lines, supporting further declines on a break below 130.20 the immediate support. In the 4 hours chart, the technical indicators also head lower and are currently approaching oversold levels, supporting the shorter term view.
Support levels: 130.20 129.80 129.40
Resistance levels: 130.90 131.30 131.70
GBP/USD Current price: 1.5128
View Live Chart for the GPB/USD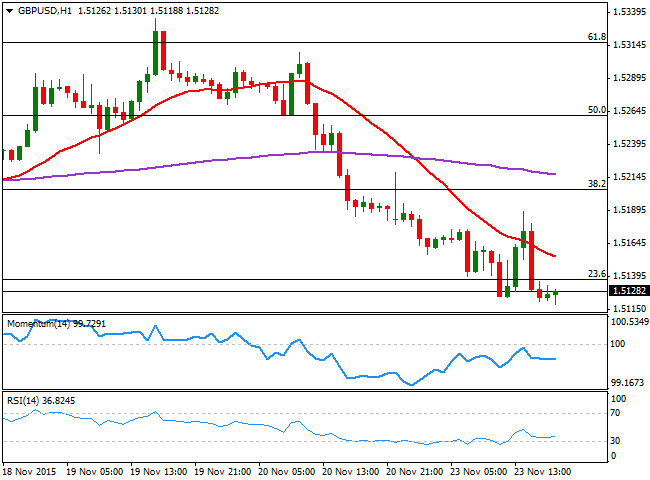
The GBP/USD pair trades near a fresh 2-week low established at 1.5118, sliding through the last Fibonacci support the 23.6% retracement of the early November decline, and pointing to return to the post-US NFP low of 1.5026. The British Pound recovered some ground ahead of the US opening, with the pair bouncing up to 1.5189 following news from the Saudi Arabia government, saying that it would do all it could to ensure price's stability in the oil market. The announcement triggered a strong bounce in oil prices, which the GBP/USD replicated, albeit it quickly gave back its gains and declined towards the mentioned low. The short term technical outlook is bearish, given that in the 1 hour chart, the price is developing well below a bearish 20 SMA, whilst the technical indicators present bearish slopes in negative territory. In the 4 hours chart, the Momentum indicator is accelerating lower well into negative territory, whilst the RSI indicator turned south around 28, all of which supports a downward continuation for the upcoming sessions.
Support levels: 1.5120 1.5085 1.5050
Resistance levels: 1.5160 1.5190 1.5220
USD/JPY Current price: 122.87
View Live Chart for the USD/JPY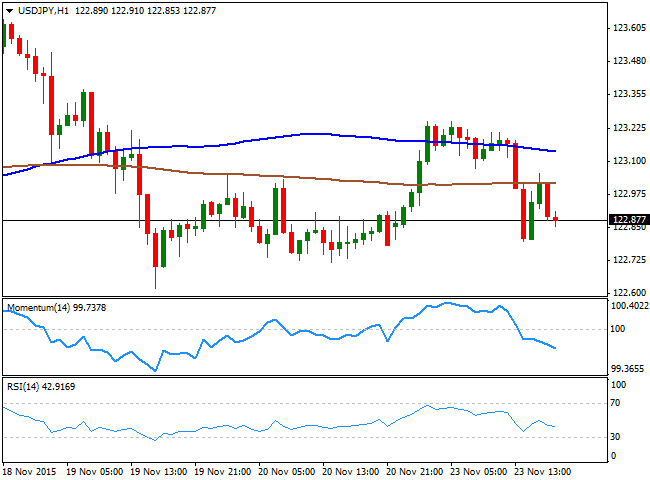
The USD/JPY pair advanced up to 123.25 at the beginning of the day, as dollar strength dominated the forex board. Nevertheless, and following a phase of consolidation, the pair came under pressure and retreated from the highs following the release of disappointing US Manufacturing PMI and existing home sales data, erasing all of its intraday gains. Again hovering a handful of pips below the 123.00 level, the 1 hour chart shows that the price faltered around its 100 SMA and is now below its 200 SMA, while the technical indicators head clearly lower below their mid-lines, in line with a steeper decline. In the 4 hours chart, the price holds near its recent lows at 122.60, the main support for the next 24 hours, the Momentum indicator lacks directional strength around its 100 level, whilst the RSI indicator heads south around 44, supporting a bearish continuation on a break below the mentioned 122.60 support.
Support levels: 123.05 122.60 122.20
Resistance levels: 123.40 123.75 124.10
AUD/USD Current price: 0.7193
View Live Chart for the AUD/USD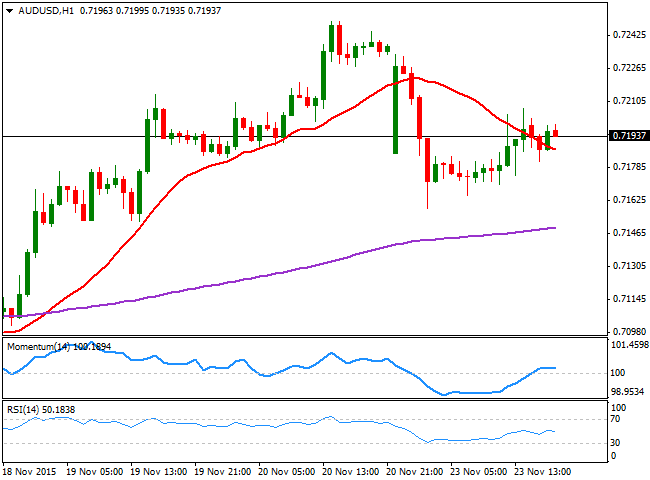
The Australian dollar came under heavy selling pressure at the beginning of the day, as commodities, and particularly precious metals, traded heavily during a thin Asian session. Cooper fell to a new six-year low, iron ore prices plummeted again, whilst gold prices continued hovering near its recent five-year lows. The AUD/USD pair fell down to 0.7158 before bouncing some, but remains unable to recover the 07200 mark as the day ends, which increases the possibility of a bearish breakout. The 1 hour chart shows that the price is above a bearish 20 SMA, whilst the technical indicators hold flat above their mid-lines, denying a short term bearish continuation. In the 4 hours chart, the price is above a bullish 20 SMA, whilst the Momentum indicator is crossing its mid-line upside down, and the RSI indicator holds around 55, in line with the shorter term perspective. The pair needs to accelerate below 0.7150 to confirm further declines, towards 0.7070 for this Tuesday.
Support levels: 0.7150 0.7110 0.7070
Resistance levels: 0.7200 0.7240 0.7285
Information on these pages contains forward-looking statements that involve risks and uncertainties. Markets and instruments profiled on this page are for informational purposes only and should not in any way come across as a recommendation to buy or sell in these assets. You should do your own thorough research before making any investment decisions. FXStreet does not in any way guarantee that this information is free from mistakes, errors, or material misstatements. It also does not guarantee that this information is of a timely nature. Investing in Open Markets involves a great deal of risk, including the loss of all or a portion of your investment, as well as emotional distress. All risks, losses and costs associated with investing, including total loss of principal, are your responsibility. The views and opinions expressed in this article are those of the authors and do not necessarily reflect the official policy or position of FXStreet nor its advertisers. The author will not be held responsible for information that is found at the end of links posted on this page.
If not otherwise explicitly mentioned in the body of the article, at the time of writing, the author has no position in any stock mentioned in this article and no business relationship with any company mentioned. The author has not received compensation for writing this article, other than from FXStreet.
FXStreet and the author do not provide personalized recommendations. The author makes no representations as to the accuracy, completeness, or suitability of this information. FXStreet and the author will not be liable for any errors, omissions or any losses, injuries or damages arising from this information and its display or use. Errors and omissions excepted.
The author and FXStreet are not registered investment advisors and nothing in this article is intended to be investment advice.
Recommended Content
Editors’ Picks
EUR/USD clings to gains above 1.0750 after US data

EUR/USD manages to hold in positive territory above 1.0750 despite retreating from the fresh multi-week high it set above 1.0800 earlier in the day. The US Dollar struggles to find demand following the weaker-than-expected NFP data.
GBP/USD declines below 1.2550 following NFP-inspired upsurge

GBP/USD struggles to preserve its bullish momentum and trades below 1.2550 in the American session. Earlier in the day, the disappointing April jobs report from the US triggered a USD selloff and allowed the pair to reach multi-week highs above 1.2600.
Gold struggles to hold above $2,300 despite falling US yields

Gold stays on the back foot below $2,300 in the American session on Friday. The benchmark 10-year US Treasury bond yield stays in negative territory below 4.6% after weak US data but the improving risk mood doesn't allow XAU/USD to gain traction.
Bitcoin Weekly Forecast: Should you buy BTC here? Premium

Bitcoin (BTC) price shows signs of a potential reversal but lacks confirmation, which has divided the investor community into two – those who are buying the dips and those who are expecting a further correction.
Week ahead – BoE and RBA decisions headline a calm week

Bank of England meets on Thursday, unlikely to signal rate cuts. Reserve Bank of Australia could maintain a higher-for-longer stance. Elsewhere, Bank of Japan releases summary of opinions.
