EUR/USD Current price: 1.0932
View Live Chart for the EUR/USD

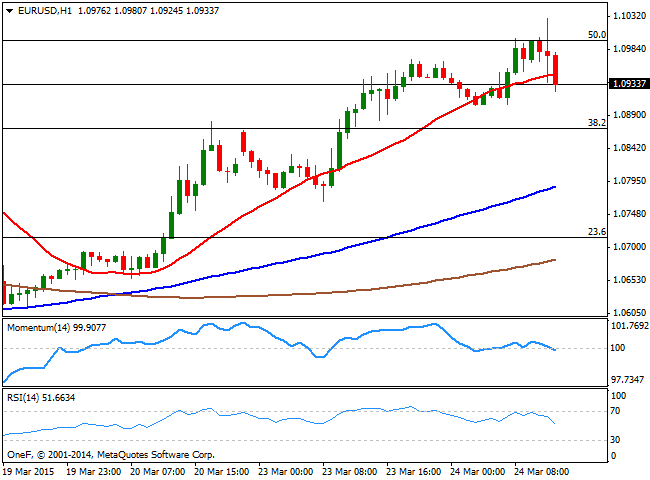
The EUR/USD surged to 1.1002 following the release of strong Manufacturing and Service figures across Europe confirming the sense the area is growing lately. Nevertheless, the pair was unable to break above the critical psychological figure, also the 50% retracement of these last two months decline. US inflation data ticked slightly higher in February, up 0.2% as expected, whilst excluding food and energy, the year-to-year figure rose above forecasted up t 1.7%. Still subdued, the initial market reaction saw the EUR/USD diving down to 1.0936 before quickly bouncing up to a fresh daily high of 1.1029, before regaining the downside. Early in the US session, the pair is under selling pressure, and the 1 hour chart shows that the price is breaking below its 20 SMA, whilst the technical indicators head lower around their midlines. In the 4 hours chart the technical indicators are retracing from extreme overbought levels, supporting some further declines, particularly on a break below 1.0920 the immediate short term support.
Support levels: 1.0920 1.0890 1.0865
Resistance levels: 1.0955 1.1000 1.1040
GBP/USD Current price: 1.4892
View Live Chart for the GBP/USD
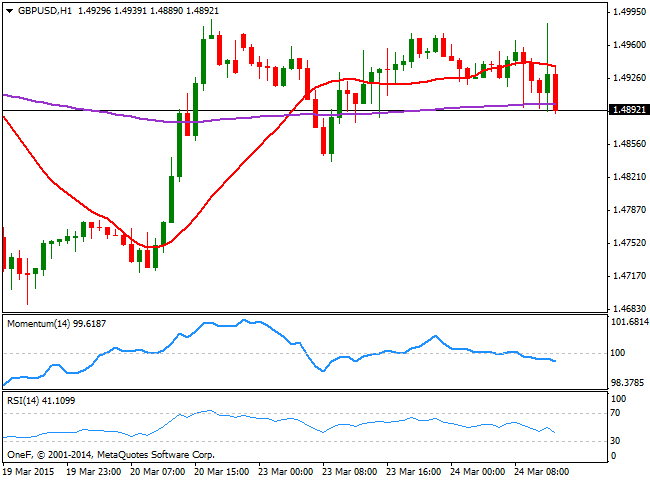
The GBP/USD pair pressures its daily low set so far at 1.4889, weighed by weak UK inflation readings released earlier in the day. The pair has been trading quite rage bound ever since the day started, although the greenback seems ready to extend its advance in the short term, as the 1 hour chart shows that the price is unable to overcome its 20 SMA, whilst the technical indicators aim lower below their midlines. In the 4 hours chart hover, the price is still holding above a flat 20 SMA, whilst the technical indicators turning lower, but still above their midlines. A break through 1.4850 the immediate support, should lead to a stronger decline, which can extend down to the 1.4770 support.
Support levels: 1.4850 1.4810 1.4770
Resistance levels: 1.4925 1.4950 1.5000
USD/JPY Current price: 119.58
View Live Chart for the USD/JPY
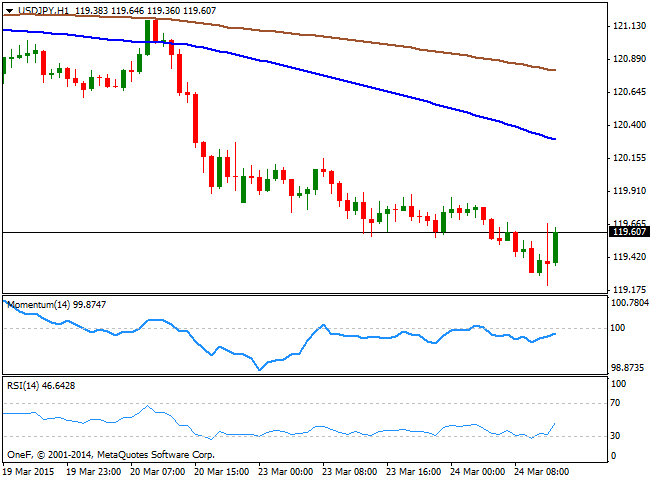
The USD/JPY fell down to a fresh 4-week low at 119-21 before bouncing back above the 119.50 level, far however from signaling a stronger advance in the short term, as the 1 hour chart shows that the price holds below strongly bearish moving averages, and that the technical indicators remain well below their midlines. In the 4 hours chart the Momentum indicator maintains a strong bearish slope while the RSI consolidates around 30 and the price stands below its moving averages, all of which should keep the upside limited, probably below the 120.00 level.
Support levels: 119.20 118.80 118.50
Resistance levels: 119.65 120.00 120.40
Recommended Content
Editors’ Picks
AUD/USD regains the constructive outlook above the 200-day SMA

AUD/USD advanced strongly for the second session in a row, this time extending the recovery to the upper 0.6500s and shifting its focus to the weekly highs in the 0.6580-0.6585 band, an area coincident with the 100-day SMA.
EUR/USD keeps the bullish performance above 1.0700

The continuation of the sell-off in the Greenback in the wake of the FOMC gathering helped EUR/USD extend its bounce off Wednesday’s lows near 1.0650, advancing past the 1.0700 hurdle ahead of the crucial release of US NFP on Friday.
Gold stuck around $2,300 as market players lack directional conviction

Gold extended its daily slide and dropped below $2,290 in the second half of the day on Thursday. The benchmark 10-year US Treasury bond yield erased its daily losses after US data, causing XAU/USD to stretch lower ahead of Friday's US jobs data.
Bitcoin price rises 5% as BlackRock anticipates a new wave of capital inflows into BTC ETFs from investors

Bitcoin (BTC) price slid to the depths of $56,552 on Wednesday as the cryptocurrency market tried to front run the Federal Open Market Committee (FOMC) meeting. The flash crash saw millions in positions get liquidated.
FOMC in the rear-view mirror – NFP eyed

The update from May’s FOMC rate announcement proved more dovish than expected, which naturally weighed on the US dollar (sending the DXY to lows of 105.44) and US yields, as well as, initially at least, underpinning major US equity indices.