EUR/USD Current price: 1.2484
View Live Chart for the EUR/USD
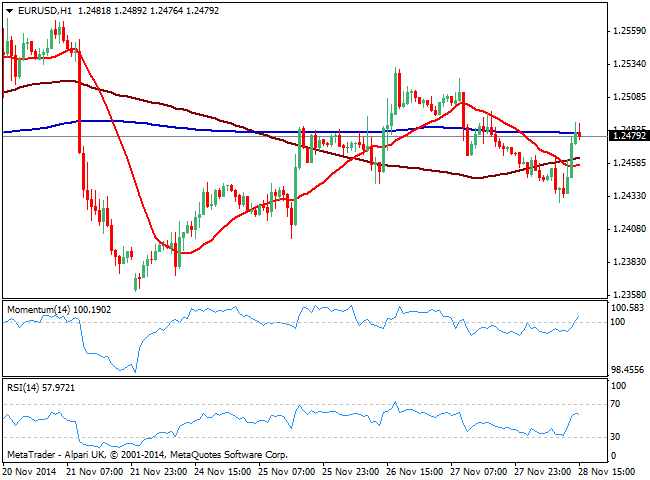
The EUR/USD pair regained the ground lost earlier on the day ahead of US opening approaching again the 1.2500 level, after posting a daily low of 1.2428 at the beginning of the European session. The main market driver continues to be oil, bouncing from multi-year lows and favoring local benchmarks, recovering ahead of the close after posting strong intraday losses. Technically, the EUR/USD hourly chart shows a mild positive tone, with price above its 20 SMA and indicators aiming higher above their midlines, albeit price retraces after failing to regain the 1.2500 mark. In the 4 hours chart indicators diverge from each other with momentum heading lower and RSI higher reflecting latest advance, and price moving back and forth around a flat 20 SMA, showing no actual directional strength. The 1.2400/1.2500 should attract buyers/sellers with a strong break of either setting a more directional tone.
Support levels: 1.2440 1.2400 1.2360
Resistance levels: 1.2520 1.2555 1.2600
GBP/USD Current price: 1.5695
View Live Chart for the GBP/USD
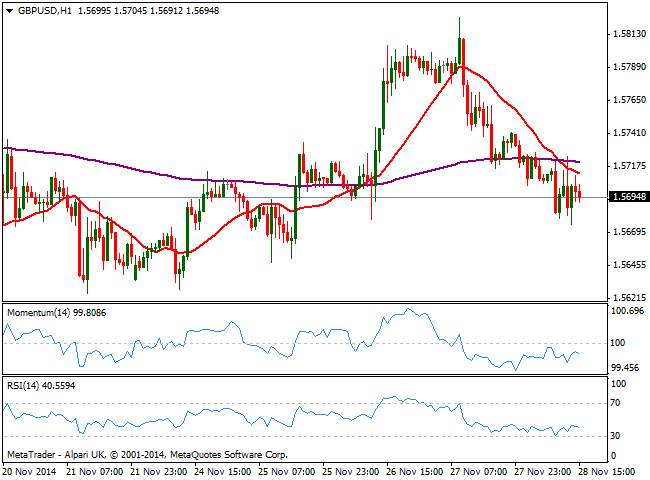
The Pound suffered against the greenback, losing its latest gains and struggling now around the 1.6700 figure. The short term picture maintains a bearish 20, with 20 SMA capping the upside and indicators heading lower below their midlines, while the 4 hours chart shows price also unable to advance beyond its 20 SMA, now flat around 1.5730, while indicators are crossing their midlines to the downside, supporting further declines on a break below 1.5660.
Support levels: 1.5660 1.5620 1.5590
Resistance levels: 1.5730 1.5770 1.5825
USD/JPY Current price: 118.40
View Live Chart for the USD/JPY
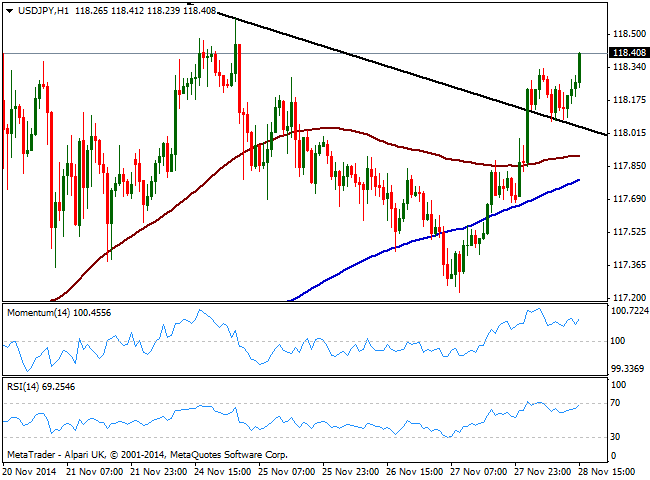
USD/JPY buyers reappeared on Friday, as the pair trades at a fresh 3-day high ahead of US opening, having recovered above its 100 and 200 SMAs in the 1 hour chart and breaking above a short term descendant trend line coming from this year high at 118.97. Indicators in the mentioned time frame head higher above their midlines, while in the 4 hours chart technical readings also present a bullish tone: as long as above 117.95 immediate support, chances are of a retest of the mentioned year high.
Support levels: 117.95 117.40 117.00
Resistance levels: 118.50 118.90 119.30
AUD/USD Current price: 0.8507
View Live Chart of the AUD/USD
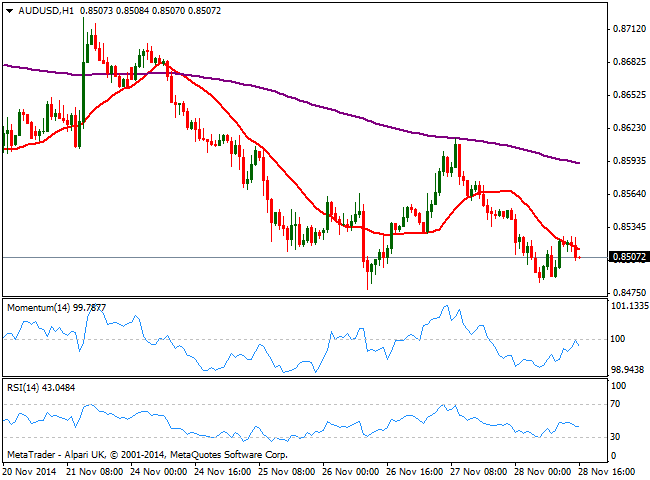
The AUD/USD pair holds near its recent lows with the 1 hour chart maintaining a bearish slope above current price an attracting short term sellers when reached, and indicators retracing from their midlines following an upward corrective movement from oversold levels. In the 4 hours chart the picture is pretty similar with a clear bearish tone ruling the pair, anticipating further slides on a break below 0.8470 immediate support.
Support levels: 0.8470 0.8435 0.8400
Resistance levels: 0.8530 0.8580 0.8620
Recommended Content
Editors’ Picks
AUD/USD regains the constructive outlook above the 200-day SMA

AUD/USD advanced strongly for the second session in a row, this time extending the recovery to the upper 0.6500s and shifting its focus to the weekly highs in the 0.6580-0.6585 band, an area coincident with the 100-day SMA.
EUR/USD keeps the bullish performance above 1.0700

The continuation of the sell-off in the Greenback in the wake of the FOMC gathering helped EUR/USD extend its bounce off Wednesday’s lows near 1.0650, advancing past the 1.0700 hurdle ahead of the crucial release of US NFP on Friday.
Gold stuck around $2,300 as market players lack directional conviction

Gold extended its daily slide and dropped below $2,290 in the second half of the day on Thursday. The benchmark 10-year US Treasury bond yield erased its daily losses after US data, causing XAU/USD to stretch lower ahead of Friday's US jobs data.
Bitcoin price rises 5% as BlackRock anticipates a new wave of capital inflows into BTC ETFs from investors

Bitcoin (BTC) price slid to the depths of $56,552 on Wednesday as the cryptocurrency market tried to front run the Federal Open Market Committee (FOMC) meeting. The flash crash saw millions in positions get liquidated.
FOMC in the rear-view mirror – NFP eyed

The update from May’s FOMC rate announcement proved more dovish than expected, which naturally weighed on the US dollar (sending the DXY to lows of 105.44) and US yields, as well as, initially at least, underpinning major US equity indices.