EUR/USD Current price: 1.3377
View Live Chart for the EUR/USD
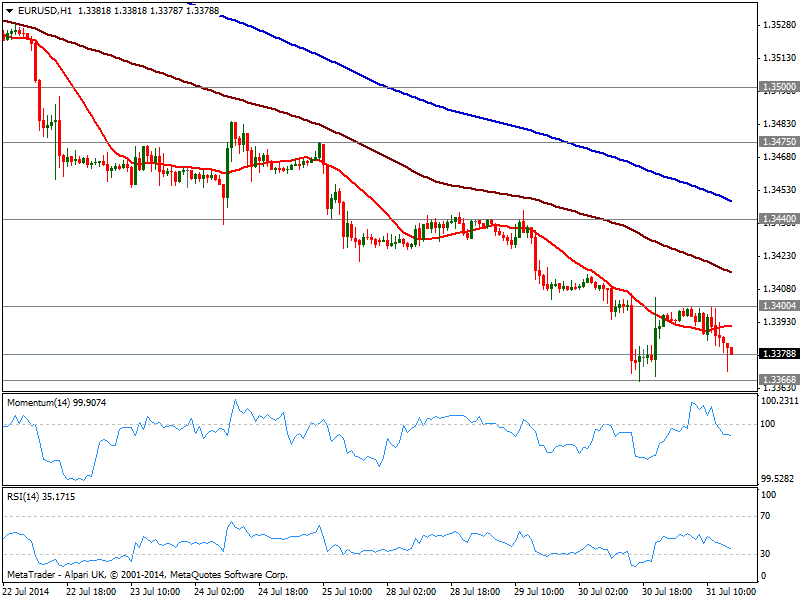
The EUR/USD maintains a heavy tone, approaching yesterday’s low after failing to overcome the 1.3400 figure during the past couple sessions. Fundamental news were no help, with EU inflation ticking down to 0.4% yearly basis, leaving the area at the verge of deflation. Technically, the hourly chart shows price below its 20 SMA and indicators heading south in negative territory, while the 4 hours also presents a bearish stance, all of which keeps the pressure to the downside. Nevertheless, market players may remain cautious ahead of Friday’s employment figures, but looking for more dollar gains if 1.3370 gives up.
Support levels: 1.3370 1.3335 1.3295
Resistance levels: 1.3405 1.3440 1.3475
GBP/USD Current price: 1.6862
View Live Chart for the GBP/USD
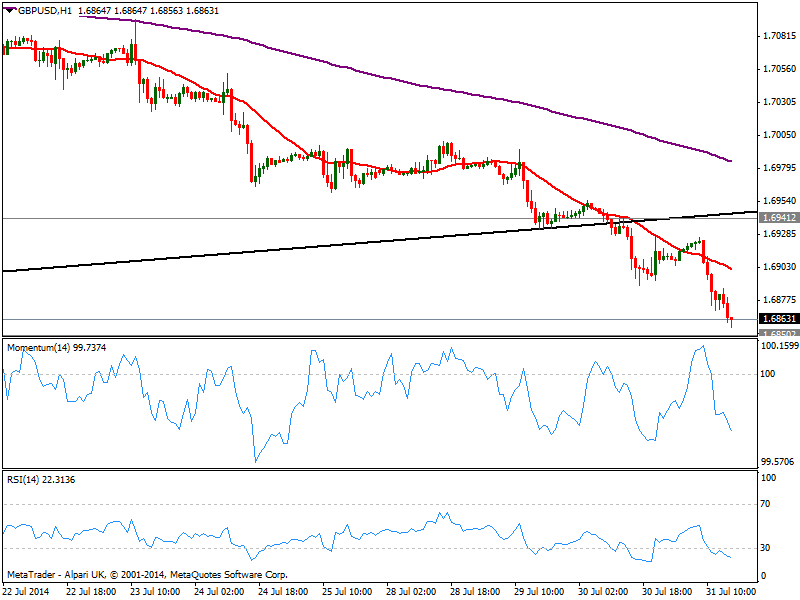
The GBP/USD extends its monthly decline against the greenback, approaching 1.6850 static support. Dollar momentum may have decelerated but gives no signs of giving ground so further losses can be expected, particularly if the mentioned level gives up. Technically, the hourly chart shows indicators clearly heading south despite in oversold levels, while 20 SMA attracted sellers earlier on the day. In the 4 hours chart indicators are also biased lower, supporting the shorter term view.
Support levels: 1.6850 1.6815 1.6770
Resistance levels: 1.6880 1.6920 1.6950
USD/JPY Current price: 102.94
View Live Chart for the USD/JPY
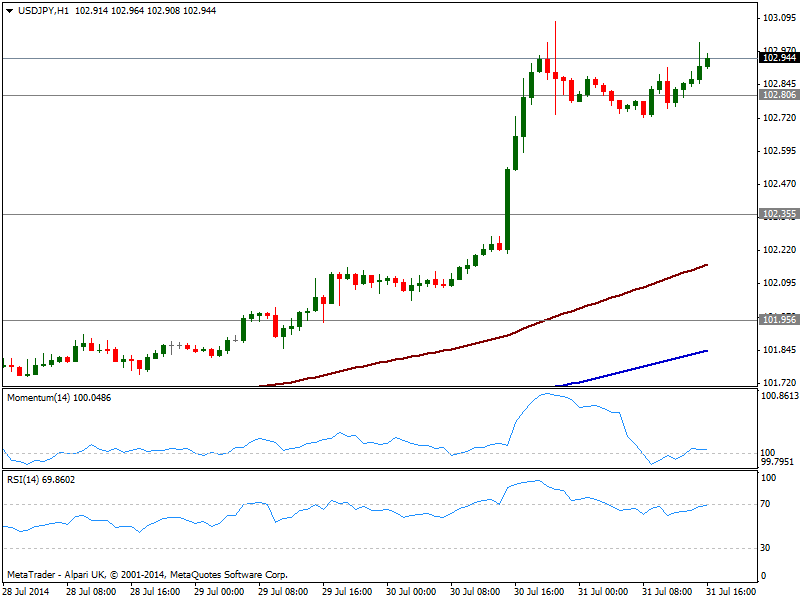
The USD/JPY holds a few pips below the 103.00 mark pretty strong early US session and despite the strong slide in local share markets. The hourly chart shows indicators mostly flat in positive territory, reflecting current consolidative stance of the pair, with immediate intraday resistance around 103.10, yesterday’s high. In the 4 hours chart indicators are also flat still in extreme overbought territory. Risk to the downside comes from stocks, as further slides there may drag the pair lower, with a break below 102.80 pointing for a possible test o 102.30/40 price zone.
Support levels: 102.80 102.35 101.95
Resistance levels: 103.10 103.40 103.80
AUD/USD Current price: 0.9288
View Live Chart for the AUD/USD
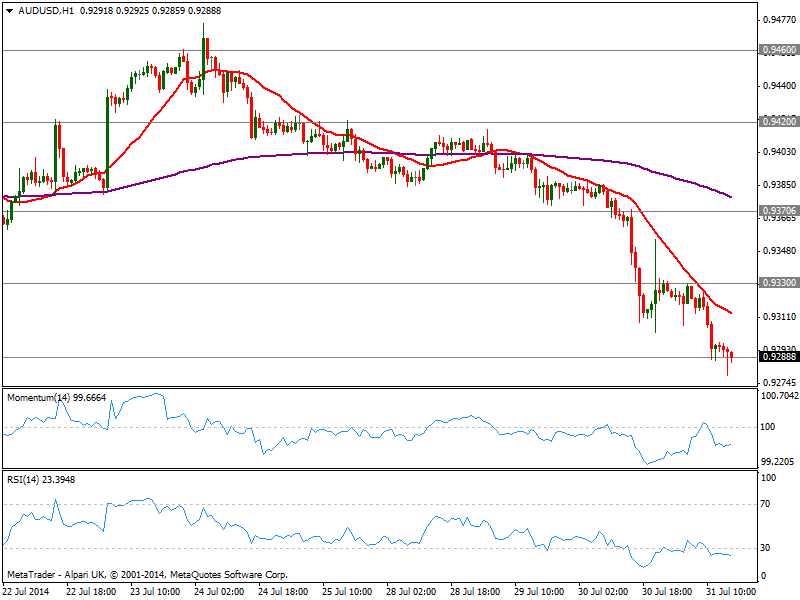
A hurdle of negative data in Australia during past Asian session: export price index fell sharply due to what we have been commenting, weaker prices for iron and coal, the country two biggest exports, adding also a slowdown in credit growth and a drop in home-building approvals. The AUD/USD accelerated below 0.9300 and quickly approaches 0.9260 strong midterm support. Not expecting a break below it at least in the short term, risk will come from US employment figures on Friday, as if they boost the greenback, the pair may end the week sub 0.9200. Technically, both 1 and 4 hours chart shows price below bearish 20 SMAs and indicators heading south in oversold territory, supporting the fundamental picture.
Support levels: 0.9260 0.9220 0.9175
Resistance levels: 0.9300 0.9330 0.9370
Recommended Content
Editors’ Picks
AUD/USD regains the constructive outlook above the 200-day SMA

AUD/USD advanced strongly for the second session in a row, this time extending the recovery to the upper 0.6500s and shifting its focus to the weekly highs in the 0.6580-0.6585 band, an area coincident with the 100-day SMA.
EUR/USD keeps the bullish performance above 1.0700

The continuation of the sell-off in the Greenback in the wake of the FOMC gathering helped EUR/USD extend its bounce off Wednesday’s lows near 1.0650, advancing past the 1.0700 hurdle ahead of the crucial release of US NFP on Friday.
Gold stuck around $2,300 as market players lack directional conviction

Gold extended its daily slide and dropped below $2,290 in the second half of the day on Thursday. The benchmark 10-year US Treasury bond yield erased its daily losses after US data, causing XAU/USD to stretch lower ahead of Friday's US jobs data.
Bitcoin price rises 5% as BlackRock anticipates a new wave of capital inflows into BTC ETFs from investors

Bitcoin (BTC) price slid to the depths of $56,552 on Wednesday as the cryptocurrency market tried to front run the Federal Open Market Committee (FOMC) meeting. The flash crash saw millions in positions get liquidated.
FOMC in the rear-view mirror – NFP eyed

The update from May’s FOMC rate announcement proved more dovish than expected, which naturally weighed on the US dollar (sending the DXY to lows of 105.44) and US yields, as well as, initially at least, underpinning major US equity indices.