EUR/USD Current price: 1.3815
View Live Chart for the EUR/USD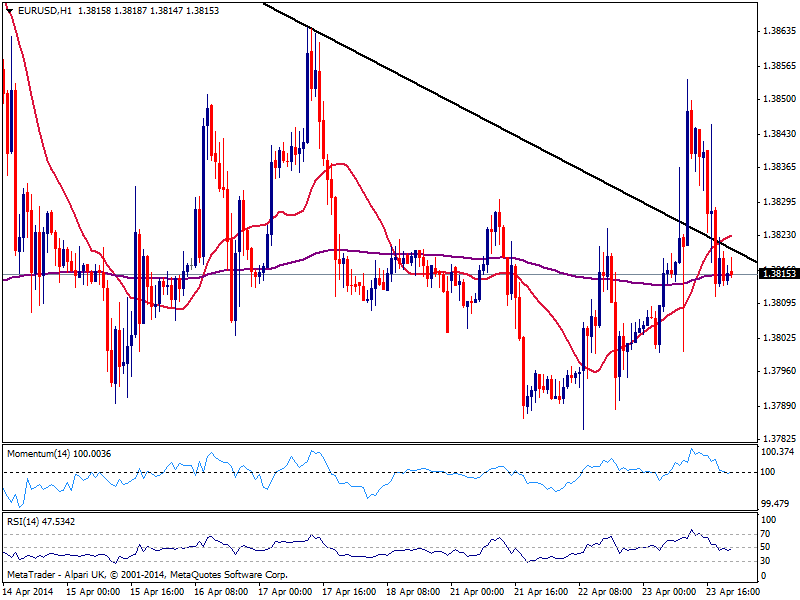
European PMIs surged, US data missed expectations and even new home sales plunged to an 8 month low, but the EUR/USD refused to advance. As commented on previous updates, seems investors are determinate to keep the range as tight as possible until next ECB meeting, to see if Super Mario will back up his words with action. The pair surged up to 1.3854 but slowly returned below the 1.3825 mark. The hourly chart shows price now below its 20 SMA and indicator flat in neutral territory, with price in its comfort zone. The 4 hour chart shows indicators maintaining the neutral stance seen over the past couple of weeks, with buyers still ready to defend the 1.3780 price zone.
Support levels: 1.3780 1.3750 1.3730
Resistance levels: 1.3825 1.3860 1.3890
EUR/JPY Current price: 141.58
View Live Chart for the EUR/JPY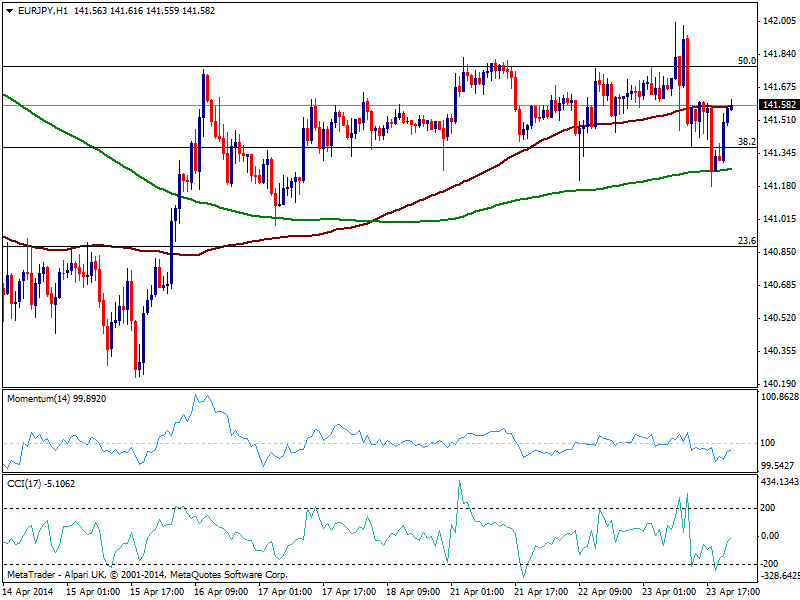
Yen advance was also erased over the US session, with the pair trading barely 10 pips away from its daily opening. The hourly chart shows price now contained below its 100 SMA while indicators aim higher below their midlines, showing no aims to extend higher. In the 4 hours chart, technical indicators present slightly bearish tone while price hovers around 100 and 200 SMAs both flat and converging for already 2 weeks, showing the little volume around the pair.
Support levels: 141.35 140.90 140.40
Resistance levels: 141.80 142.20 142.60
GBP/USD Current price: 1.6780
View Live Chart for the GBP/USD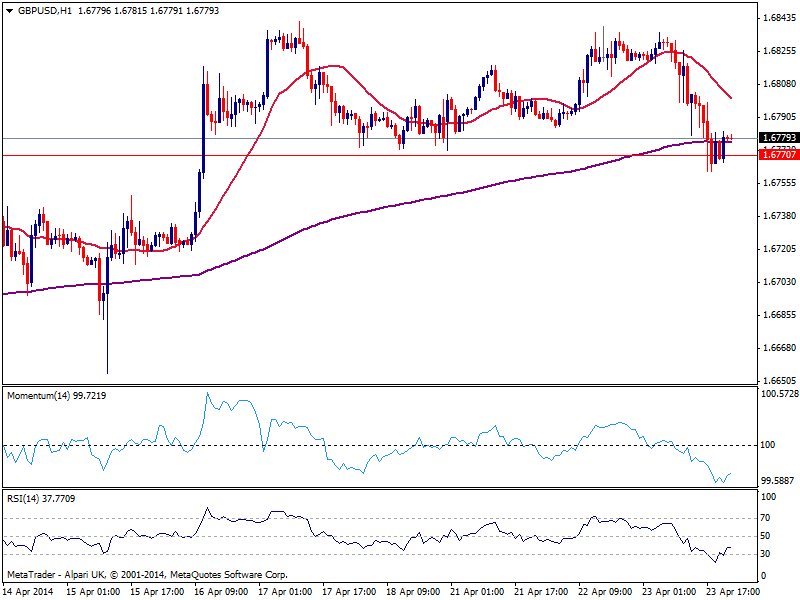
Pound was initially forced lower against the greenback by EUR/GDP demand, remaining under pressure for the rest of the day. The hourly chart shows price having a hard time right above 1.6770 price zone with indicators just correcting oversold readings and 20 SMA with a strong bearish slope above current price. In the 4 hours chart technical readings maintain the bearish momentum keeping the downside exposed for the upcoming hours, and as long as price remains capped below 1.6820 immediate resistance.
Support levels: 1.6770 1.6745 1.6710
Resistance levels: 1.6820 1.6870 1.6915
USD/JPY Current price: 102.53
View Live Chart for the USD/JPY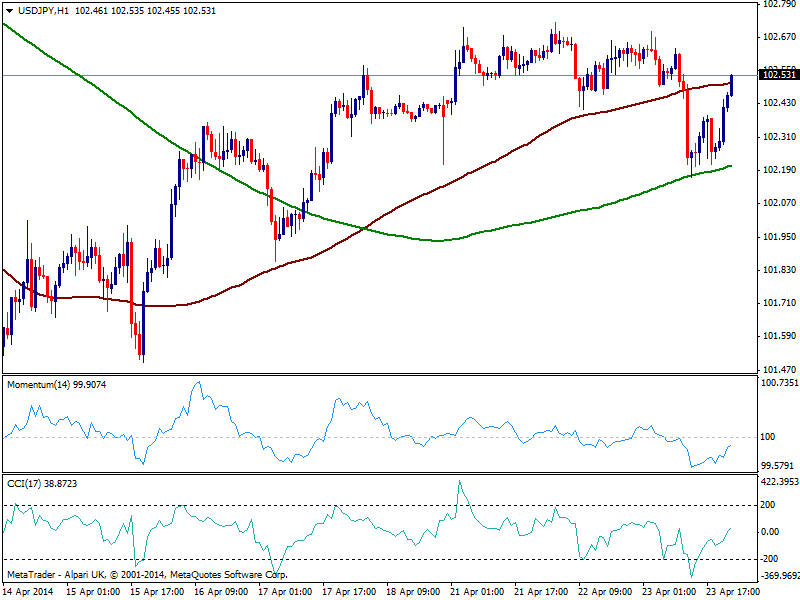
The USD/JPY managed to recover the ground lost in Asia, trading again right below the 102.60 static resistance zone. With US stocks soaring after the close, the pair may well extend its advance over the upcoming hours. Technically, the short term picture shows price capped below 100 SMA, while indicators aim higher still below their midlines. In the 4 hours chart the bearish momentum seen on previous update has receded with indicators now turning flat below their midlines.
Support levels: 102.10 101.70 101.30
Resistance levels: 102.60 102.95 103.20
AUD/USD Current price: 0.9289
View Live Chart for the AUD/USD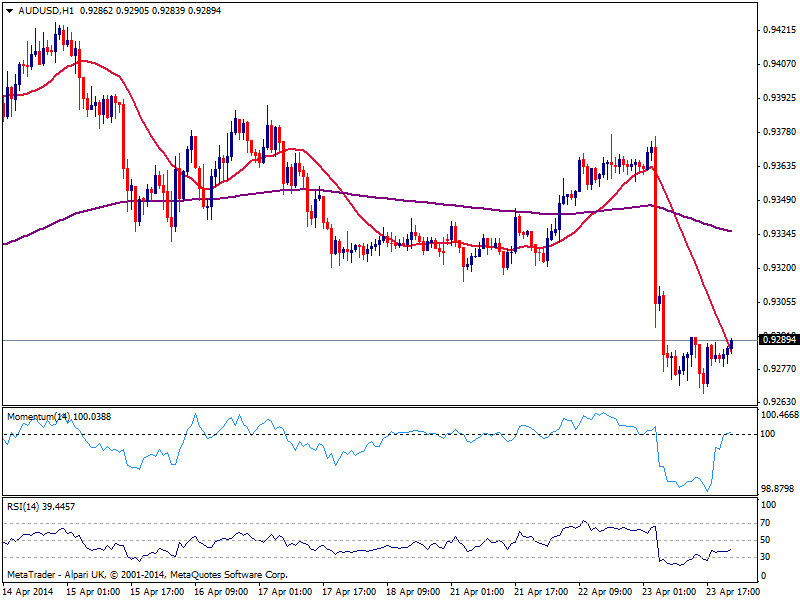
Aussie finally stopped its bleeding against the greenback presenting a shy recovery afterwards, contained below 0.9300 figure. The hourly chart shows price struggling around bearish 20 SMA while momentum turns flat in neutral territory. In the 4 hours chart bias remain to the downside albeit with no strength at the time being. Further falls should be expected if price breaks below mentioned support, albeit RBNZ decision may give Aussie a hand today.
Support levels: 0.9260 0.9210 0.9370
Resistance levels: 0.9300 0.9340 0.9380
Recommended Content
Editors’ Picks
AUD/USD regains the constructive outlook above the 200-day SMA

AUD/USD advanced strongly for the second session in a row, this time extending the recovery to the upper 0.6500s and shifting its focus to the weekly highs in the 0.6580-0.6585 band, an area coincident with the 100-day SMA.
EUR/USD keeps the bullish performance above 1.0700

The continuation of the sell-off in the Greenback in the wake of the FOMC gathering helped EUR/USD extend its bounce off Wednesday’s lows near 1.0650, advancing past the 1.0700 hurdle ahead of the crucial release of US NFP on Friday.
Gold stuck around $2,300 as market players lack directional conviction

Gold extended its daily slide and dropped below $2,290 in the second half of the day on Thursday. The benchmark 10-year US Treasury bond yield erased its daily losses after US data, causing XAU/USD to stretch lower ahead of Friday's US jobs data.
Bitcoin price rises 5% as BlackRock anticipates a new wave of capital inflows into BTC ETFs from investors

Bitcoin (BTC) price slid to the depths of $56,552 on Wednesday as the cryptocurrency market tried to front run the Federal Open Market Committee (FOMC) meeting. The flash crash saw millions in positions get liquidated.
FOMC in the rear-view mirror – NFP eyed

The update from May’s FOMC rate announcement proved more dovish than expected, which naturally weighed on the US dollar (sending the DXY to lows of 105.44) and US yields, as well as, initially at least, underpinning major US equity indices.