Chart of the Week: NZD/USD faces headwind of turmoil
- NZD/USD bears move on new critical weekly support.
- All eyes on the US dollar for Jackson Hole, NZD covid risks, central bank divergence.

The bears have been in charge and eating up the bird as its breaks below critical daily support.
The following is an analysis of the US dollar and the New Zealand dollar arriving at a longer-term bearish bias, albeit with near-term prospects of a bullish correction in the kiwi.
As per prior analysis into the Reserve Bank of New Zealand and subsequent price action, the NZD has continued to bleed out as forecasted.
NZD/USD prior analysis, weekly chart
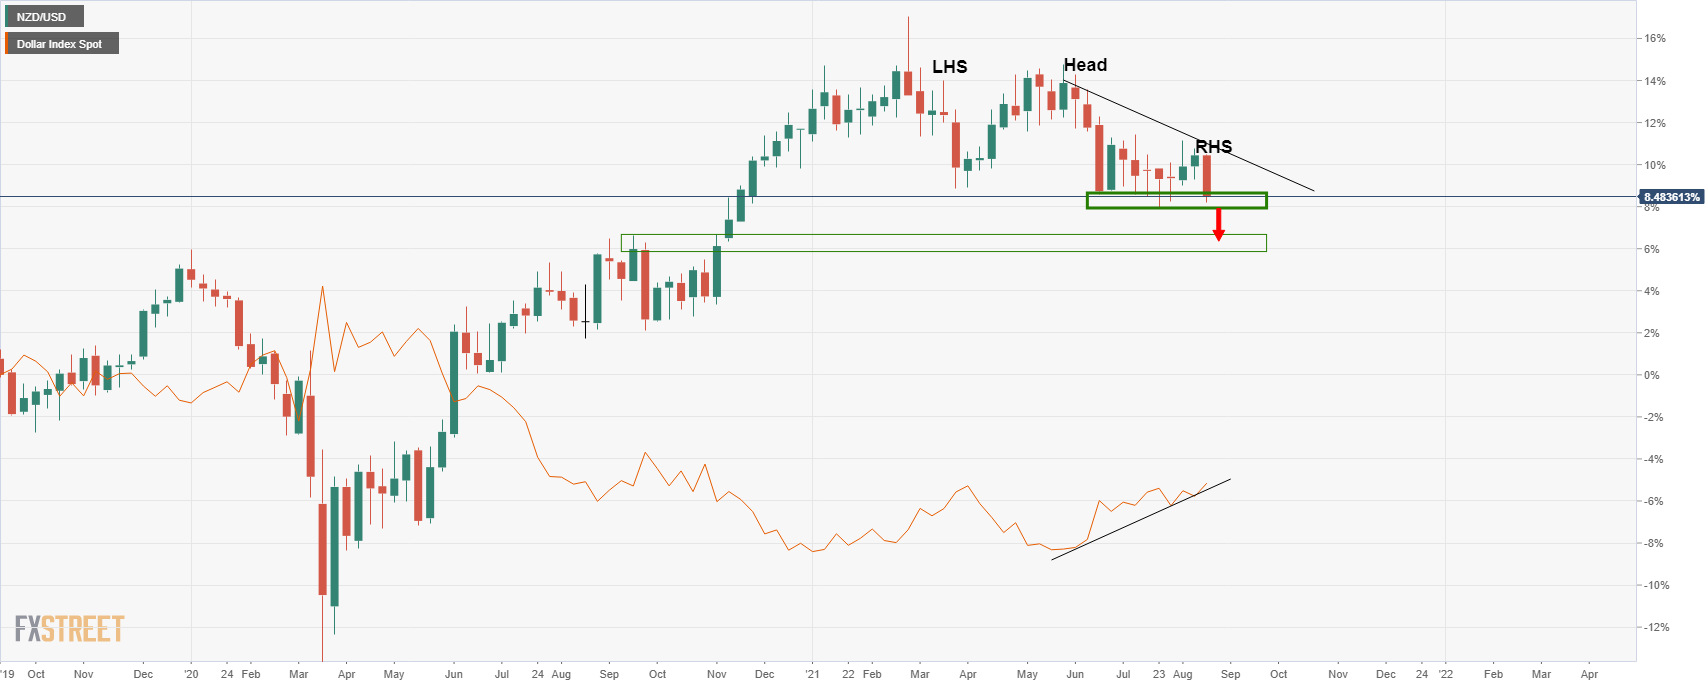
''In the above weekly chart, the head and shoulders are marked and so too are the key support zones.
"The US dollar has also been compared and the negative correlation speaks volumes when taking into consideration of the bullish environment the US dollar is embarking on, as highlighted in the following analysis:
"If the kiwi is stripped of a hawkish bias at the RBNZ that it has enjoyed for many weeks, then the path of least resistance is to the downside.''
NZD/USD prior daily chart analysis

''The price is stable in a critical support zone.
"However, an advancement in the greenback through a critical confluence of resistance in the DXY, above 93.50, would likely see the bord break to the next boundaries below and test 0.6750.''
DXY prior analysis
"The US dollar is attempting to recover the CPI losses from the prior day, closing higher but still below the recent tops at 93.1920.
"Below there, then the downside is vulnerable towards the midpoint of the 92 area that meets the 61.8% Fibonacci retracement level at 92.52.''
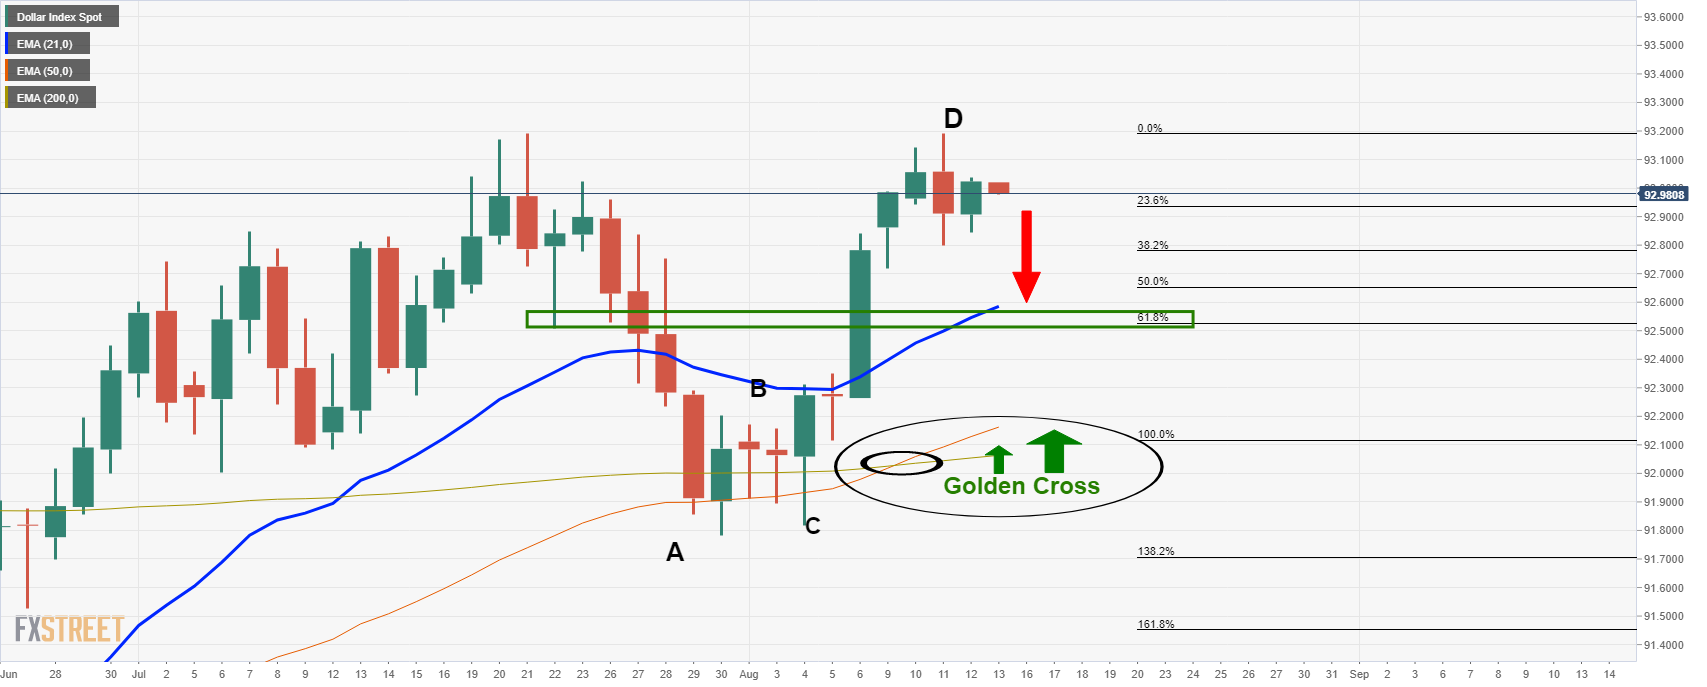
''Overall, the Golden Cross (50/200-day EMA bullish cross over) would be expected to lead to a higher US dollar in the coming days and weeks.
"However, the confluence of the 21-day EMA and July 22 lows is a compelling reversion target for the bears that are otherwise having to contend with some meanwhile strength in the greenback.''
Prior projected path for DXY
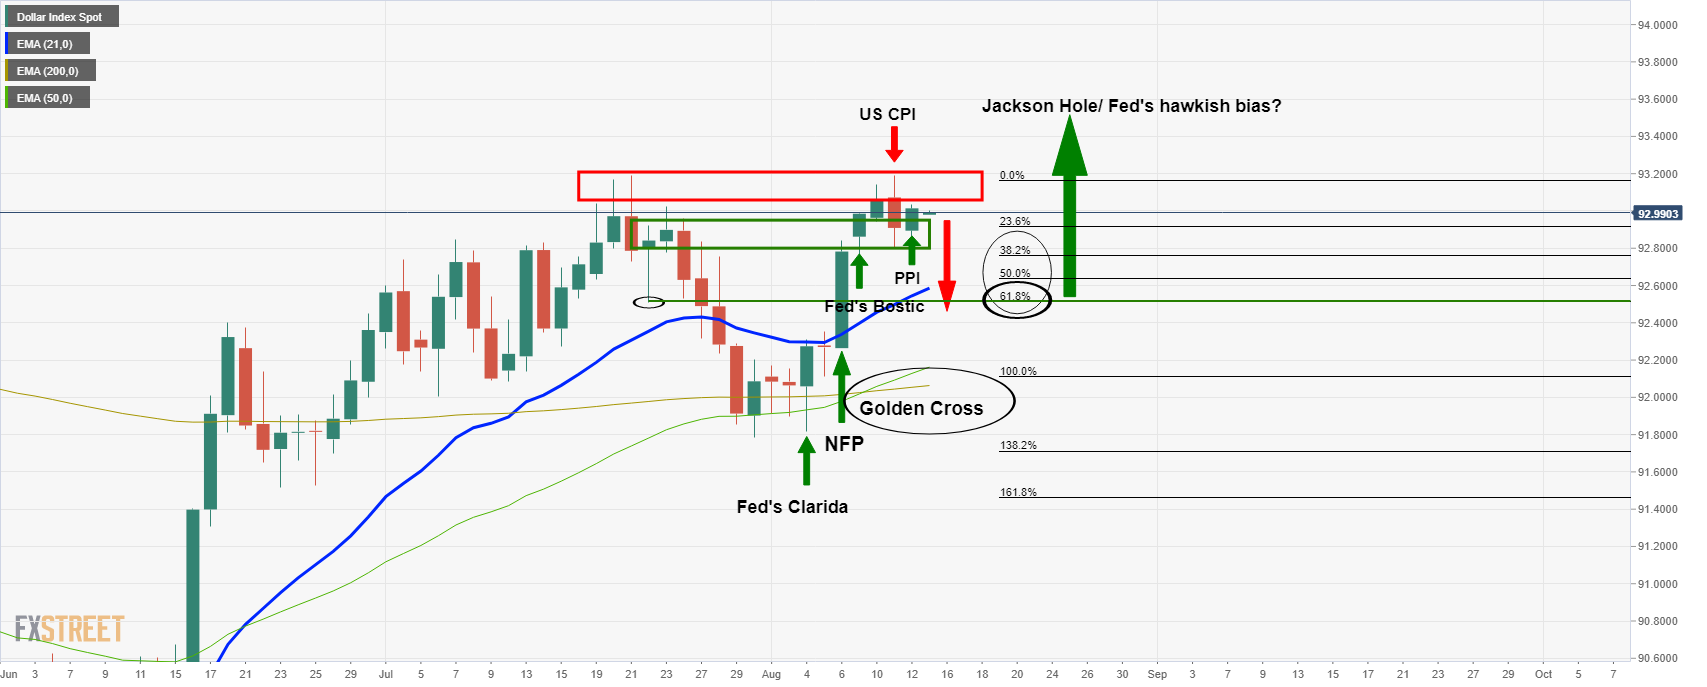
''The above chart illustrates the series of fundamental events that have led to the recent Golden Cross on the daily time frame.''
DXY live market analysis
As forecasted, above and with follow-up explanation here: US dollar bid for its safe-haven status and on central bank divergence, DXY has made its move through 93.50:
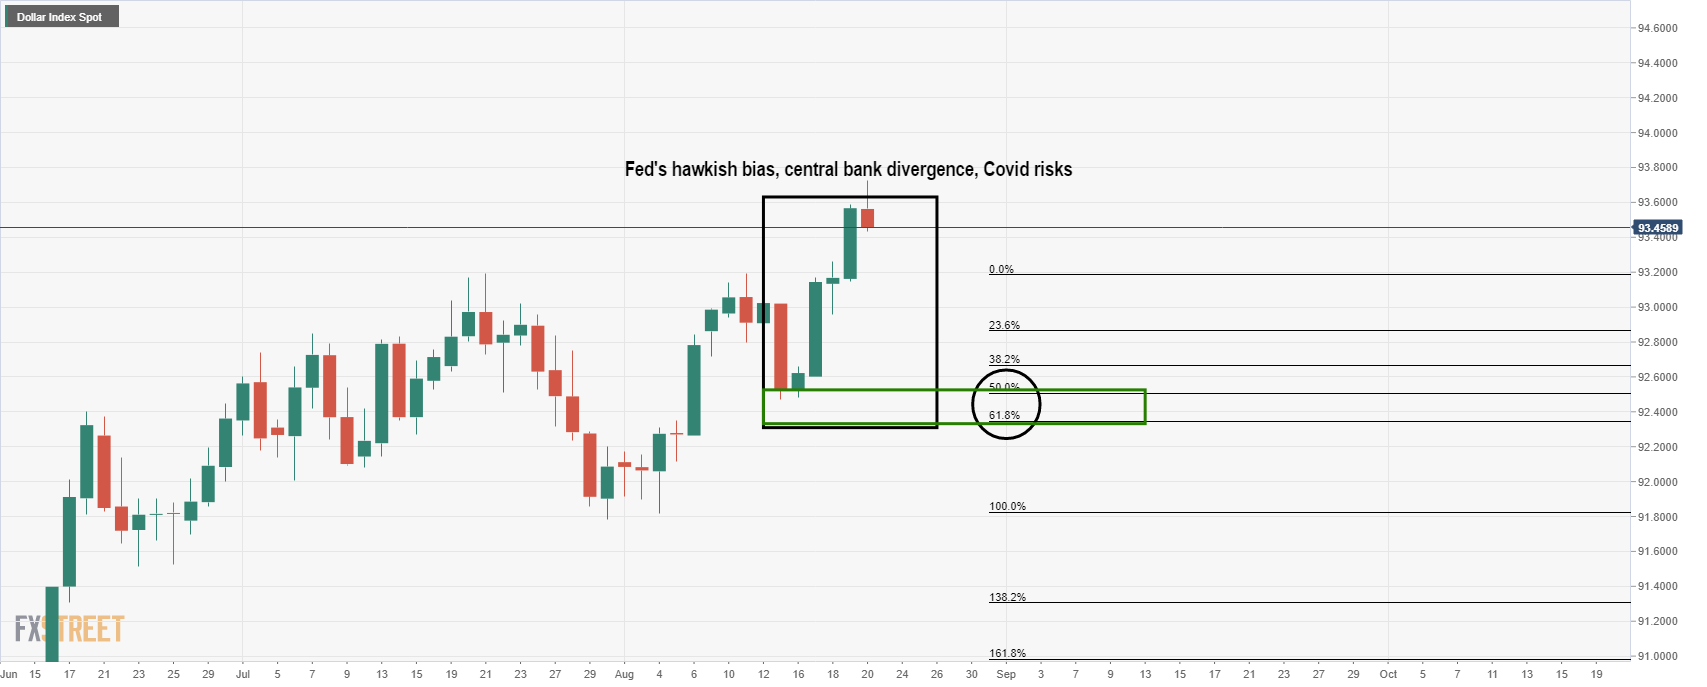
With that being said, it is yet to convince with a weekly or a monthly close above 93.50:
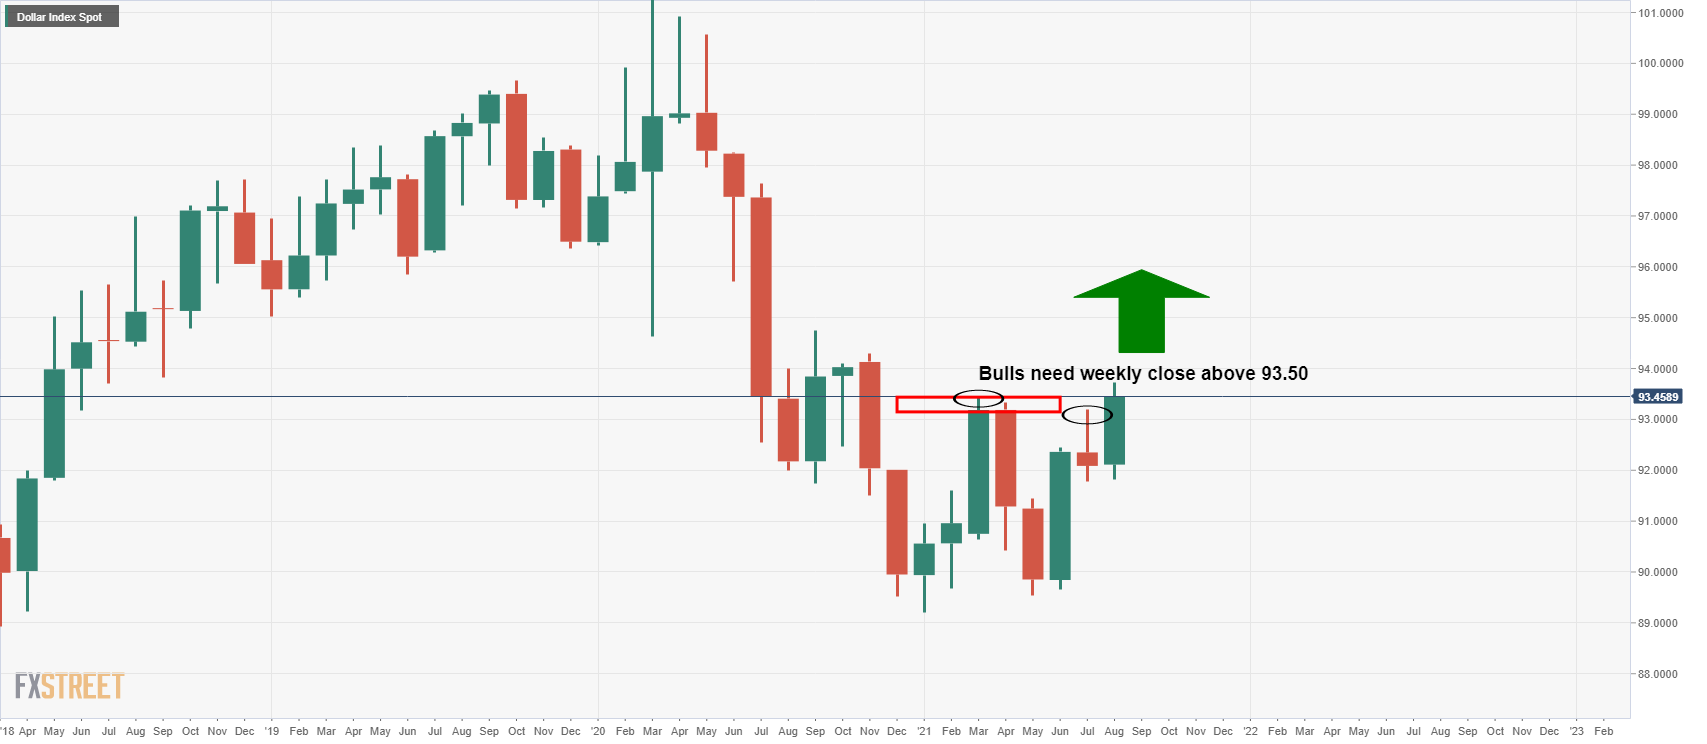
This leaves scope for some give in the greenback leading into the next critical events: the Jackson Hole symposium from August 26 to 28 and the Fed's preferred measure of inflation, PCE, on August 27.
In doing so, this would offer the bird some relief and would make for prospects of a significant correction for the forthcoming days and the open.
NZD/USD daily chart live market analysis
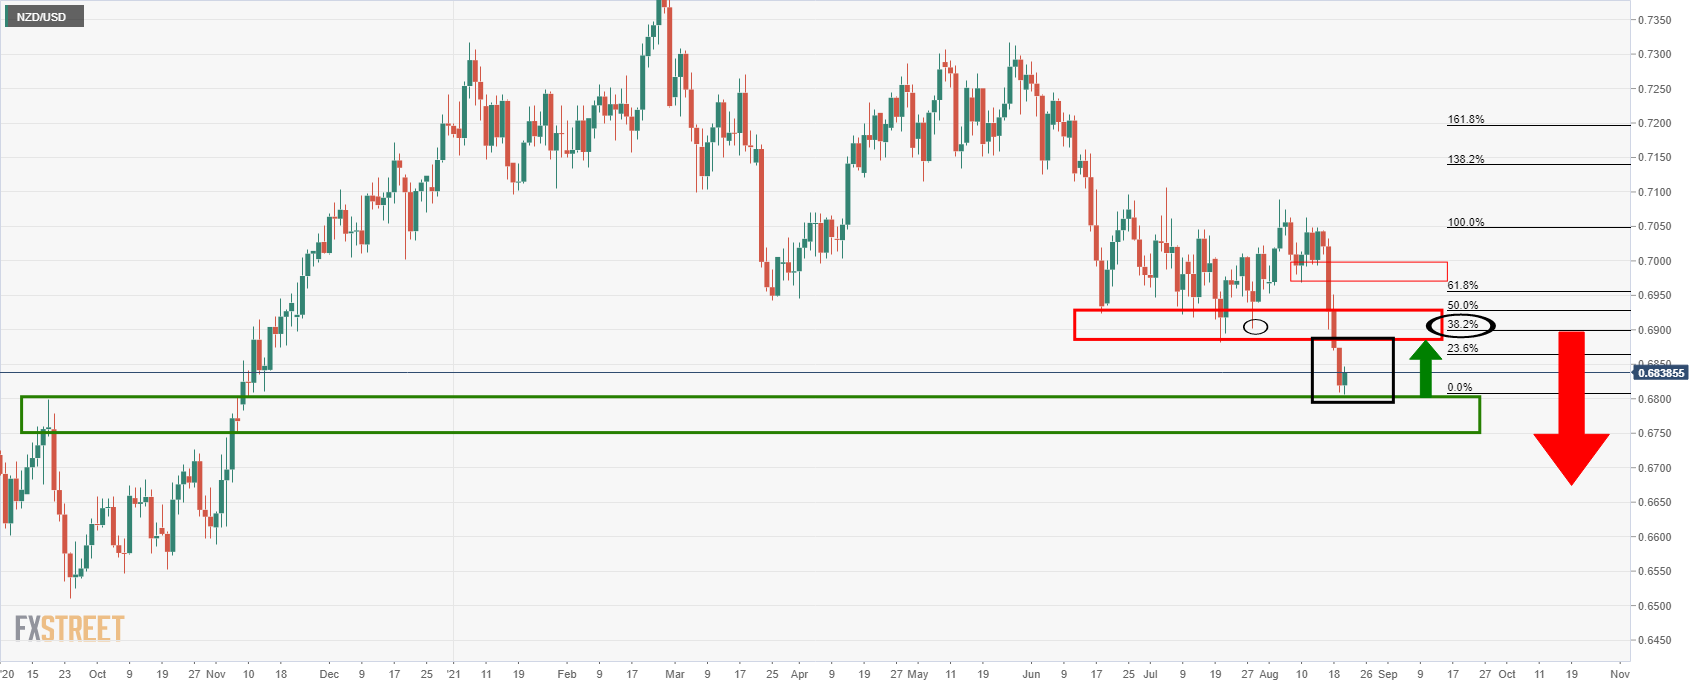
As illustrated above, the price has made it to the first area of support as forecasted in the prior analysis above.
This raises prospects of a correction to test the bearish commitments from at least a 38.2% Fibonacci retracement level that has a confluence of the prior lows near 0.69 – the figure for the days ahead.
A subsequent failure on the retest of the presumed resistance area would be expected to lead to a continuation of the downtrend.
This depends on the performance of the greenback at month end and following the Jackson Hole summit.
However, given the US dollar's fundamental drivers and its technical position on the charts, all of which is explained in the following article, the US dollar is expected to remain in the driving seat for the weeks to come.
When coupled with the hopes that some of New Zealand might be able to move out of a full lockdown early, a policy that seemsto be up in the air, NZD could be in for some supply pressures.
Premium
You have reached your limit of 3 free articles for this month.
Start your subscription and get access to all our original articles.
Author

Ross J Burland
FXStreet
Ross J Burland, born in England, UK, is a sportsman at heart. He played Rugby and Judo for his county, Kent and the South East of England Rugby team.


