AUD/USD rallies from the extreme within a corrective structure

Since the low of October 2022, AUDUSD has rallied and faltered multiple times. The pair has been in a range between the high of February 2023 and the low of October 2022. However, even within a range, traders can spot opportunities in the shorter time frames. As for the Aussie, the pair completed the supercycle degree wave (I) in March 2020. Since the end of wave (I), the pair has rallied sharply with an impulse sequence that ended in February 2021. Since then, it has been in a corrective cycle that we have identified as a double three structure. We update the detailed weekly and daily charts every weekend, or sometimes within the week, for members to understand the long-term path.
Our long-term forecast sees the rally from the October 2022 low as a connector that could lead to the extension of the larger bearish corrective sequence from February 2021. Meanwhile, the last setup on AUDUSD was along the path of the connector—upside. Within the 30-month range, we expected the pair to hit at least 0.6955. With this in mind, we shared a bullish bias with members on the H4 and H1 charts. Let’s look at the latest setup on this pair.
AUD/USD Elliott Wave analysis
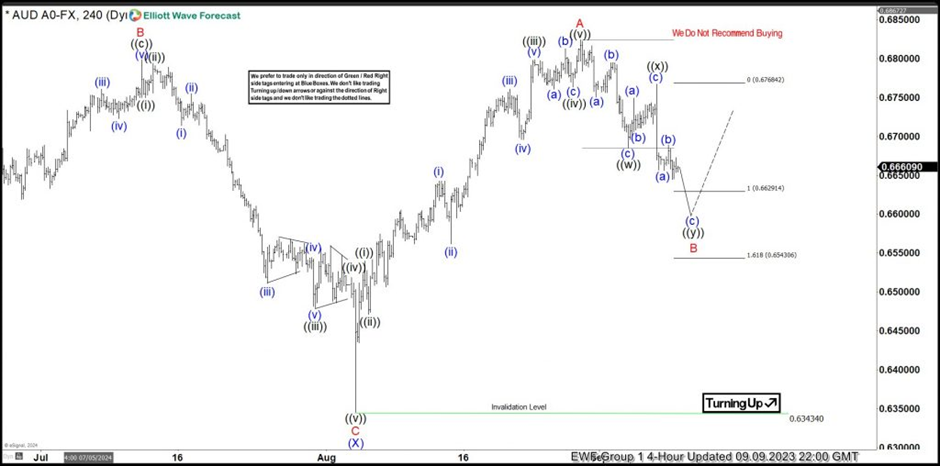
On 09.09.2024, we shared the H4 chart above with members. After the price completed wave (X) of ((X)) on 08.05.2024, it rallied sharply with an impulse structure. We identified the impulse sequence from 08.05.2025 as wave A of (Y) of ((X)). In addition, we identified the pullback that followed as a corrective double three structure, labeled as wave B. Thus, we expected that wave B would find support in the extreme zone between 0.6629 and 0.6543. From the extreme, we anticipated at least a 3-swing bounce. We provided the extreme zone for independent members who would like to buy in this kind of scenario. While that was the path we expected, we would prefer to buy after wave A’s high is breached. Consequently, we can buy the next pullback.
AUD/USD Elliott Wave analysis
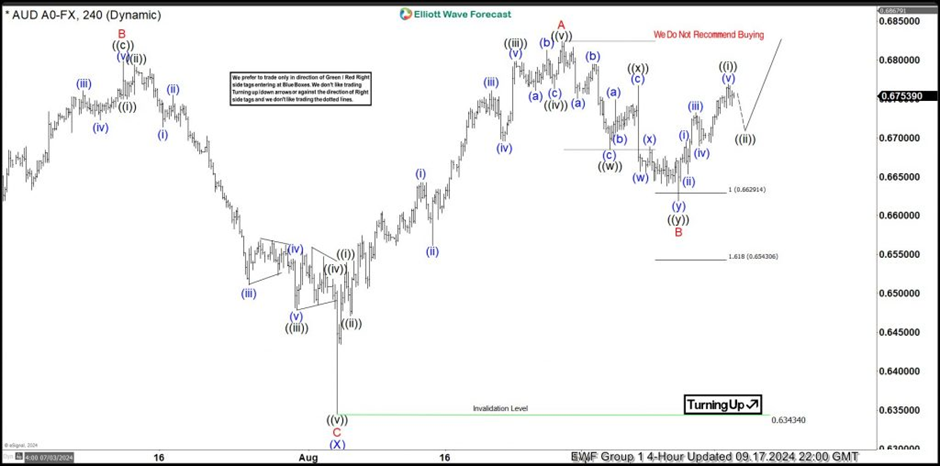
AUDUSD, H4
Price reached the extreme as expected, confirming the completion of a double zigzag structure for wave B. Afterwards, an impulse rally followed in wave ((i)) of C. Thus, wave C could extend to 0.7090. Meanwhile, we are expecting a breach of wave A high, opening more room to the upside and confirming that wave B has finished. Afterward, we would like to buy pullbacks when they complete 3, 7, or 11 swings.
Author

Elliott Wave Forecast Team
ElliottWave-Forecast.com