Chart of the Week: Commodity currencies in focus, bears in control
- Commodity currencies are on the backfoot for the open.
- AUD/USD bears seek a break of interim support.

With the Federal Open Market Committee and headlines regarding the Delta variant, the week ahead will be an important one from both a fundamental and technical perspective.
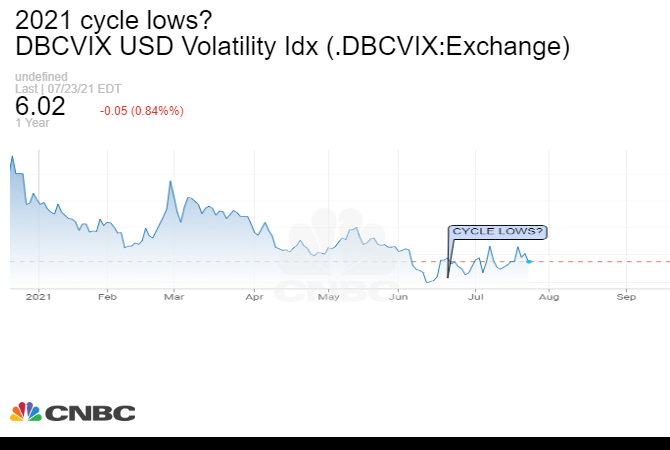
The watchlist for swing trading FX is heating up as volatility picks up from multi-month lows amidst broad US dollar strength:
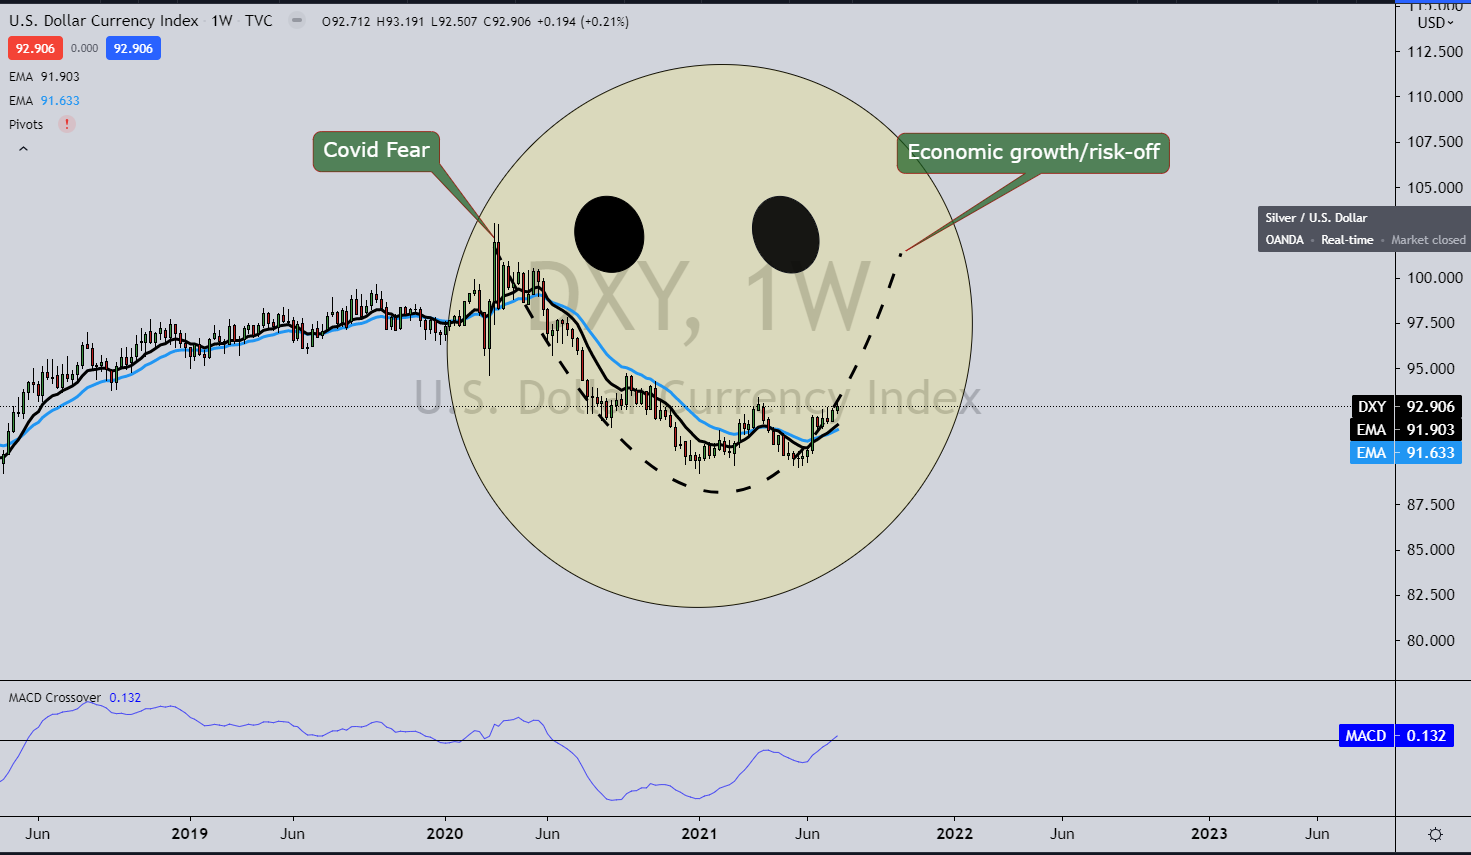
With the US dollar smile theory also in play (net dollar value is long for the first time since the pandemic began), the commodity complex is set for a bumpy ride.
This leaves the commodity currency vulnerable, especially the Aussie, considering central bank divergences.
AUD/USD technical analysis
AUD/USD is facing headwinds across the time frames, from the monthly all the way down to the 4-hour chart.
On a monthly basis, the price has broken the monthly old resistance turned support, and the Japanese candlestick is on the path to close bearish at the end of this month:
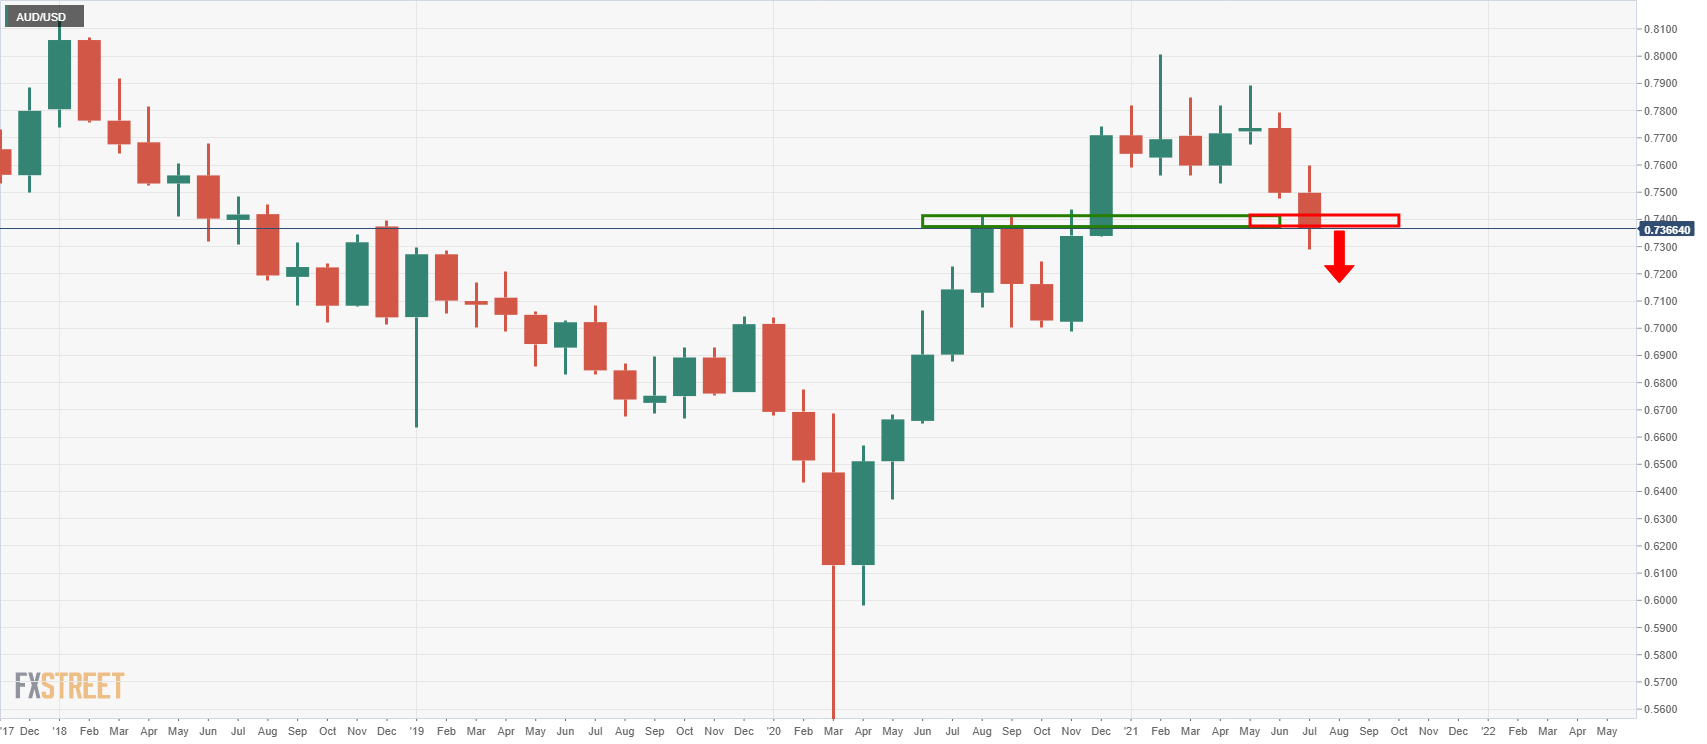
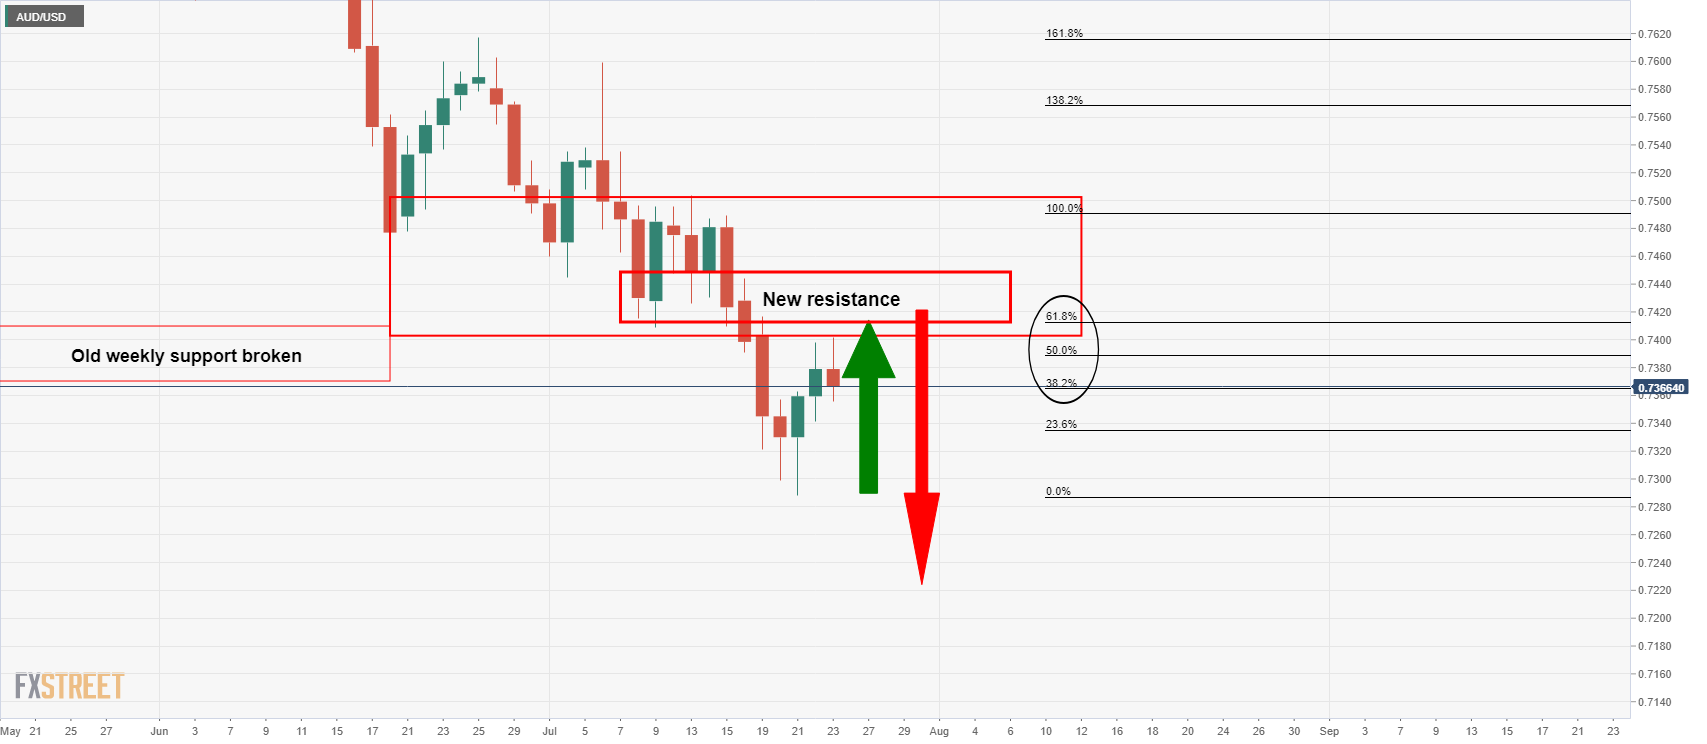
From a weekly perspective, the candle closed bearish last week ending July 23, which leaves scope for a downside continuation in the days ahead:
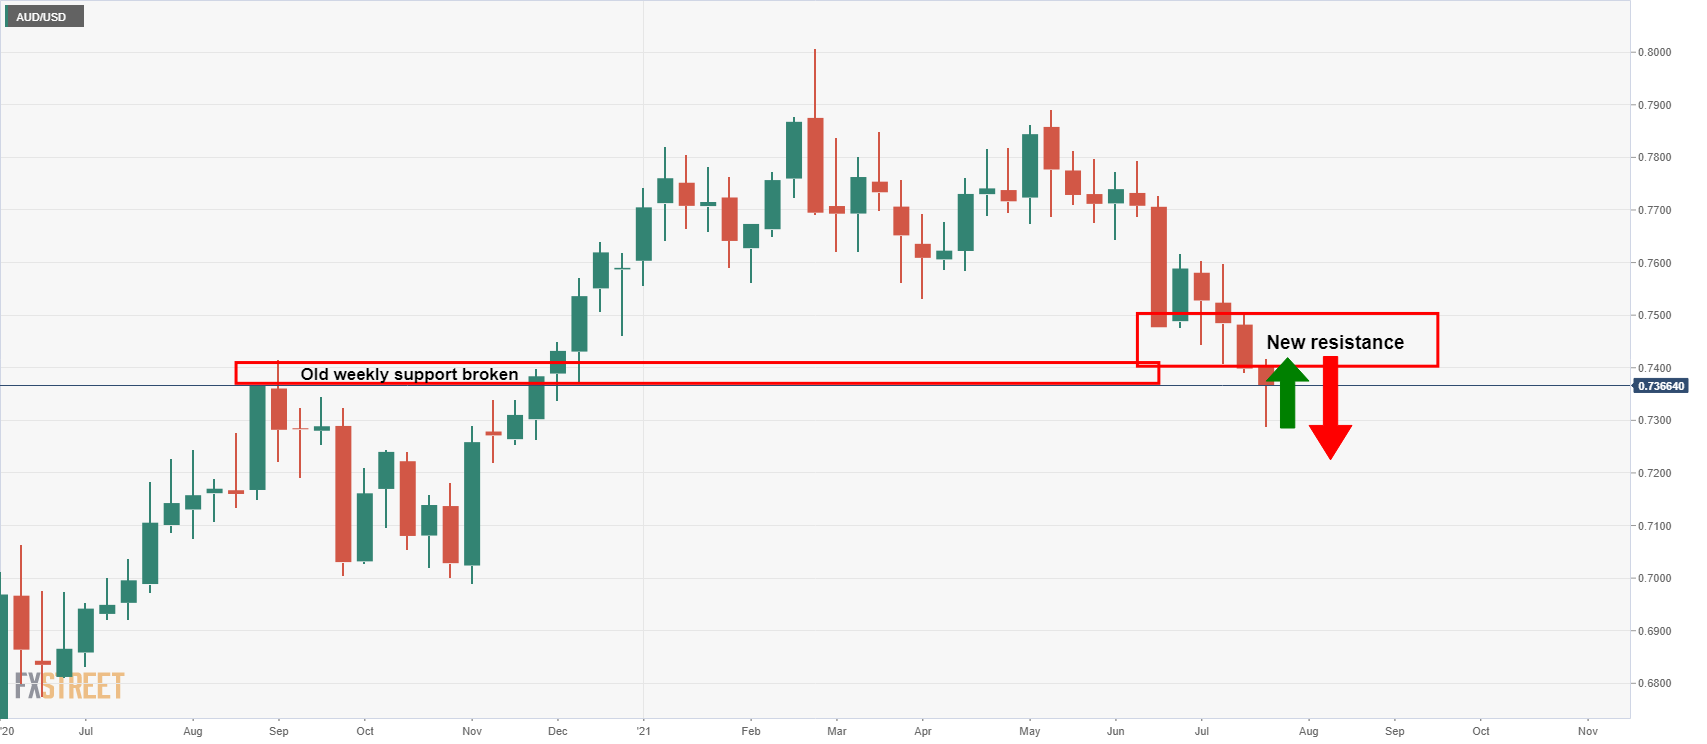
On a daily perspective, the price has corrected 50% from the prior bearish impulse near 0.7390 and bears are looking for an imminent optimal short entry point on the lower time frames:
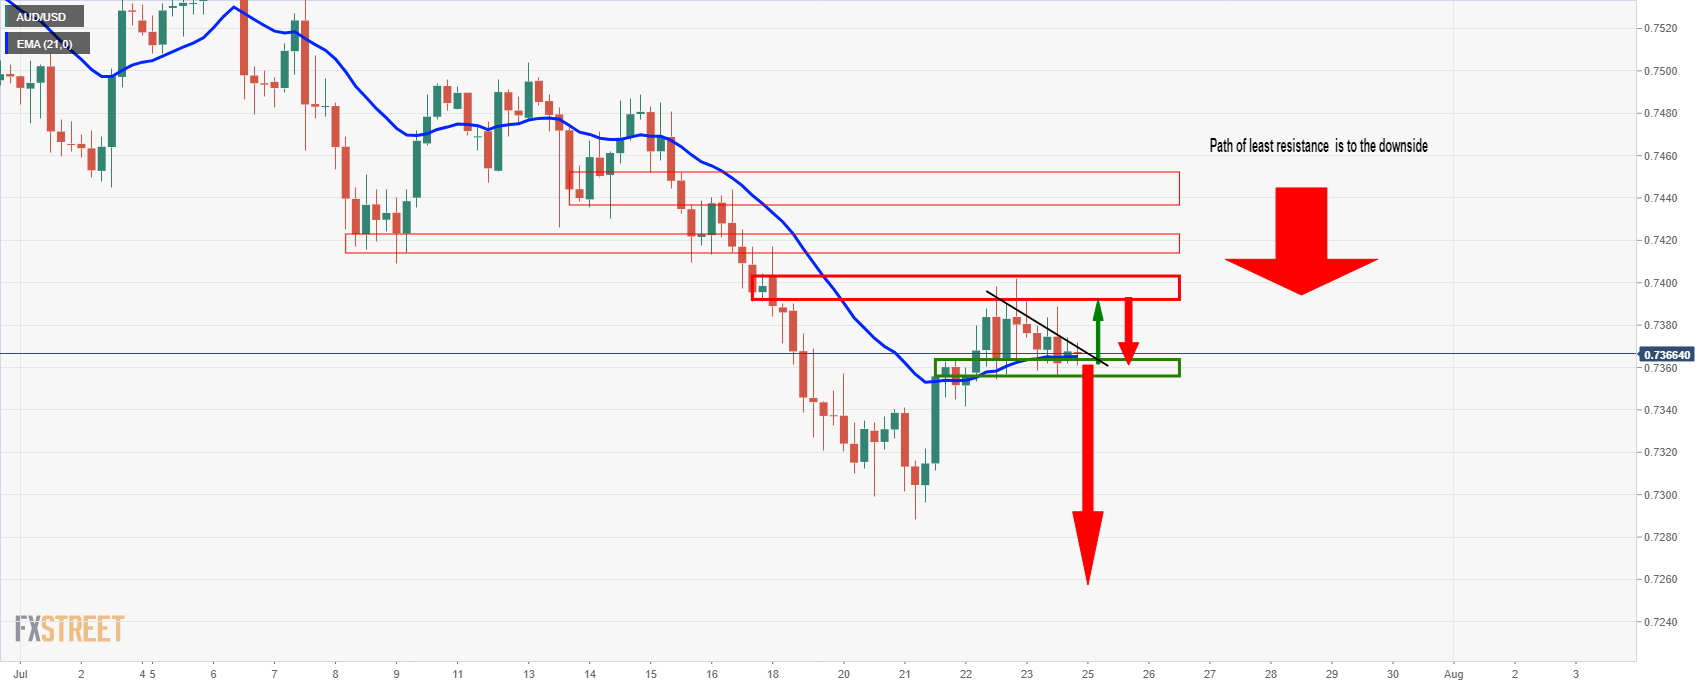
The 4-hour chart shows that the price is on the verge of breaking support below the 21 four-hour Exponential Moving Average (EMA) and, according to the FXStreet Technical Confluence Detector, below various strong confluences that would also be expected to act as resistance:
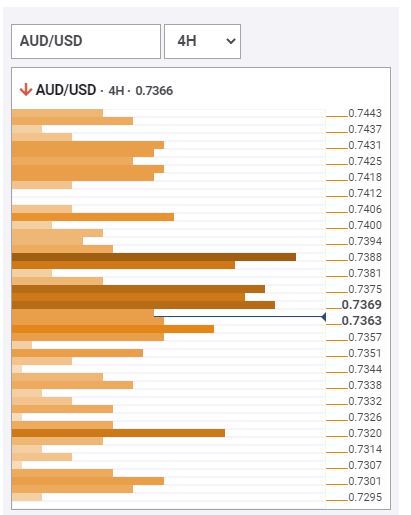
The FXS Technical Confluences Detector is an in-house tool, developed by FXStreet experts, that allows you to identify those price levels where congestion of indicators like moving averages, Fibonacci levels and pivot points occur. Knowing where these congestion points are located is very helpful as it allows the trader to see these areas of support and resistance easily.
This tool is customizable so you can choose the asset selectors and the time frame that is more suitable for your trading operations.
Other correlated pairs on the watchlist
Meanwhile, we can see similar developments in NZD/USD and AUD/JPY:
AUD/JPY daily chart
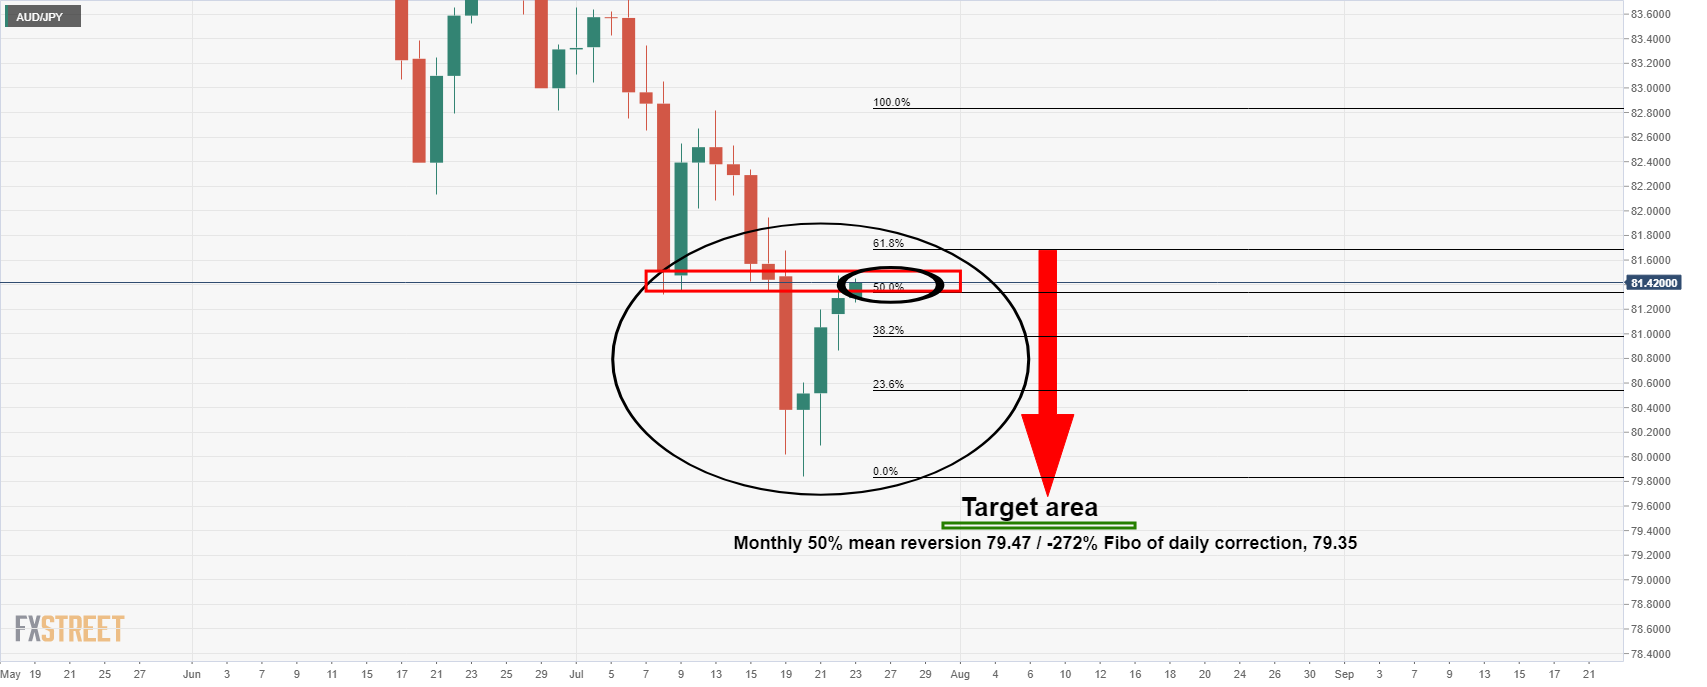
- Prior Analysis, 07/23/2021: AUD/JPY Price Analysis: Daily resistance continues to hold
NZD/USD daily chart
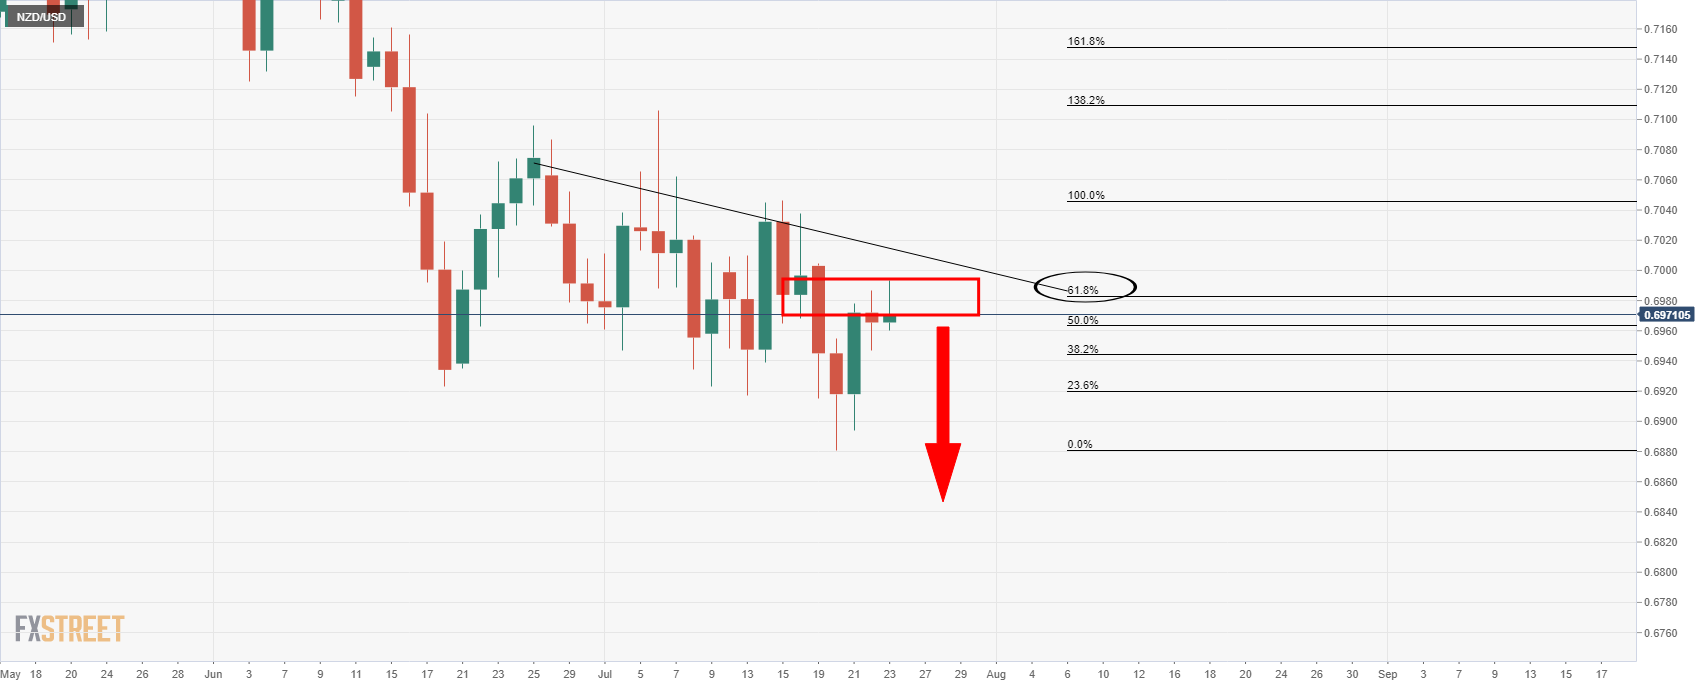
- Prior Analysis 07/22/2021: NZD/USD Price Analysis: Bears seeking a daily downside extension
Premium
You have reached your limit of 3 free articles for this month.
Start your subscription and get access to all our original articles.
Author

Ross J Burland
FXStreet
Ross J Burland, born in England, UK, is a sportsman at heart. He played Rugby and Judo for his county, Kent and the South East of England Rugby team.


