USD/CAD Price Forecast: 200-day EMA acts as key barrier
- USD/CAD turns sideways near 1.3570 after correcting from a three-week high of 1.3623.
- Investors await the US PPI for August and the weekly Initial Jobless Claims data.
- Sticky US core inflation cements Fed smaller rate cut prospects.

The USD/CAD pair trades in a tight range near 1.3570 in Thursday’s European session after falling from a three-week high near 1.3620 on Wednesday. The Loonie asset could recover sooner as the US Dollar (USD) trades close to a fresh weekly high, with the US Dollar Index (DXY), which tracks the Greenback’s value against six major currencies, trading near 101.80.
The outlook for the US Dollar has improved as investors see the Federal Reserve (Fed) starting to reduce interest rates gradually. For the past few weeks, traders have been split over whether the Fed will deliver 25-basis points (bps) or a 50-bps interest rate cut in September. The United States (US) Consumer Price Index (CPI) data for August, released on Wednesday, showed signs of stickiness in inflationary pressures, which forced traders to pare Fed sizeable interest rate cut bets.
In today’s session, investors will focus on the US Producer Price Index (PPI) data for August and the Initial Jobless Claims for the week ending September 6, which will be published at 12:30 GMT.
Meanwhile, the Canadian Dollar (CAD) has come under pressure amid growing speculation that the Bank of Canada (BoC) will cut interest rates again this year. Investors seem to be confident that the BoC will extend its policy-easing cycle as the Canadian labor market conditions continue to deteriorate. August job data showed that the Unemployment Rate rose to 6.6%. The BoC has already reduced its key borrowing rates by 75 basis points (bps) to 4.25% this year.
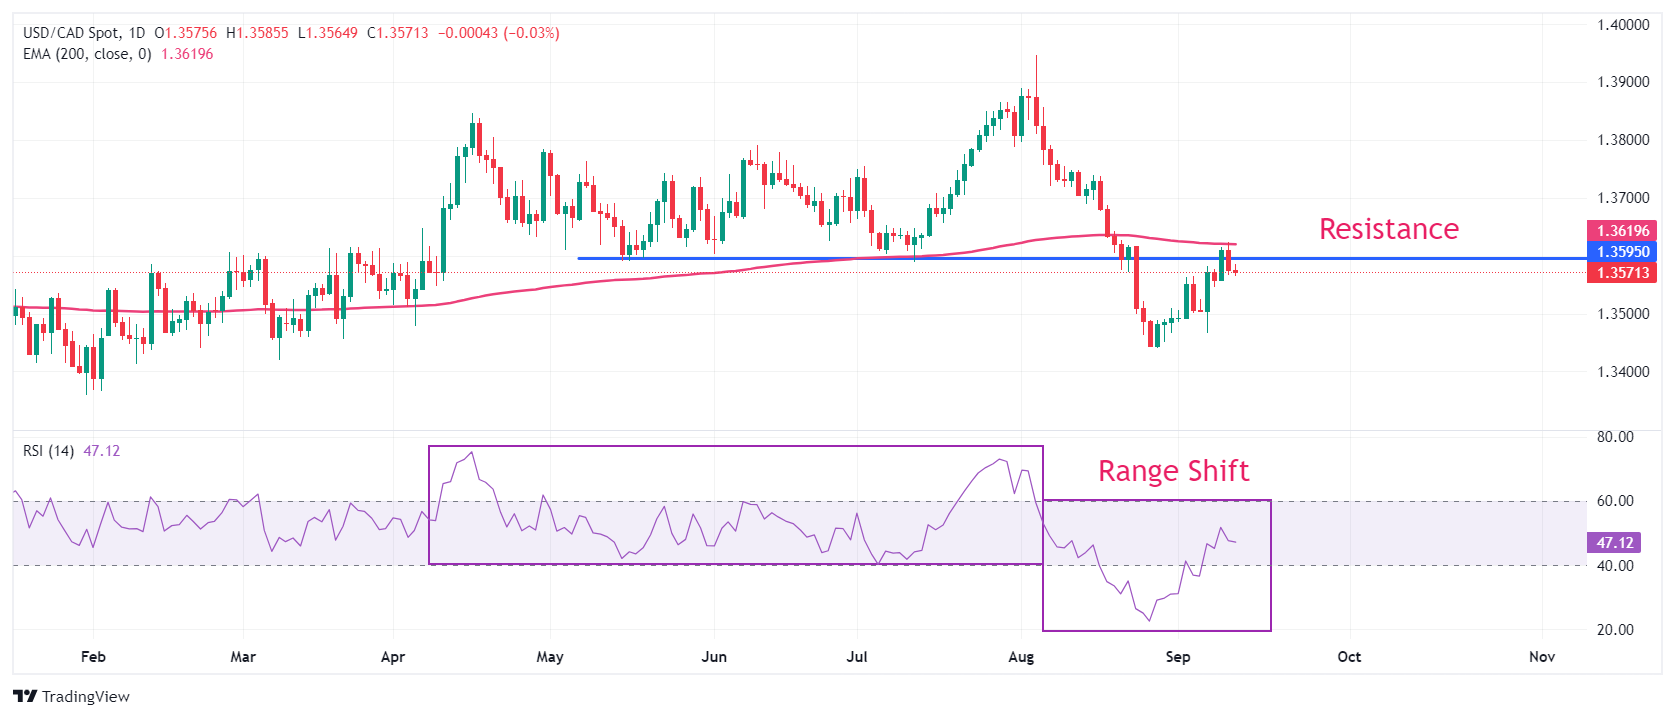
USD/CAD delivers a mean reversion to near the 200-day Exponential Moving Average (EMA), which trades around 1.3620. The near-term outlook of the pair appears to be bearish as the 14-day Relative Strength Index (RSI) has shifted into the bearish range of 20.00-60.00 from 40.00-80.00.
The horizontal resistance plotted from May 15 low of 1.3590 continues to act as a major barricade for the US Dollar bulls.
An upside recovery above August 21 high of 1.3626 would drive the asset towards 19 August high of 1.3687 and August 15 high of 1.3738.
On the flip side, further correction below April 5 low of 1.3540 will drag the asset towards the psychological support of 1.3500, followed by September 6 low of 1.3466.
USD/CAD daily chart
Canadian Dollar FAQs
The key factors driving the Canadian Dollar (CAD) are the level of interest rates set by the Bank of Canada (BoC), the price of Oil, Canada’s largest export, the health of its economy, inflation and the Trade Balance, which is the difference between the value of Canada’s exports versus its imports. Other factors include market sentiment – whether investors are taking on more risky assets (risk-on) or seeking safe-havens (risk-off) – with risk-on being CAD-positive. As its largest trading partner, the health of the US economy is also a key factor influencing the Canadian Dollar.
The Bank of Canada (BoC) has a significant influence on the Canadian Dollar by setting the level of interest rates that banks can lend to one another. This influences the level of interest rates for everyone. The main goal of the BoC is to maintain inflation at 1-3% by adjusting interest rates up or down. Relatively higher interest rates tend to be positive for the CAD. The Bank of Canada can also use quantitative easing and tightening to influence credit conditions, with the former CAD-negative and the latter CAD-positive.
The price of Oil is a key factor impacting the value of the Canadian Dollar. Petroleum is Canada’s biggest export, so Oil price tends to have an immediate impact on the CAD value. Generally, if Oil price rises CAD also goes up, as aggregate demand for the currency increases. The opposite is the case if the price of Oil falls. Higher Oil prices also tend to result in a greater likelihood of a positive Trade Balance, which is also supportive of the CAD.
While inflation had always traditionally been thought of as a negative factor for a currency since it lowers the value of money, the opposite has actually been the case in modern times with the relaxation of cross-border capital controls. Higher inflation tends to lead central banks to put up interest rates which attracts more capital inflows from global investors seeking a lucrative place to keep their money. This increases demand for the local currency, which in Canada’s case is the Canadian Dollar.
Macroeconomic data releases gauge the health of the economy and can have an impact on the Canadian Dollar. Indicators such as GDP, Manufacturing and Services PMIs, employment, and consumer sentiment surveys can all influence the direction of the CAD. A strong economy is good for the Canadian Dollar. Not only does it attract more foreign investment but it may encourage the Bank of Canada to put up interest rates, leading to a stronger currency. If economic data is weak, however, the CAD is likely to fall.
Author

Sagar Dua
FXStreet
Sagar Dua is associated with the financial markets from his college days. Along with pursuing post-graduation in Commerce in 2014, he started his markets training with chart analysis.


