Tesla Stock Deep Dive: Price target at $133 on China headwinds, margin compression, lower deliveries
- Tesla trades on an incredibly optimistic valuation despite recent share price fall.
- Tesla is likely to suffer from rising input costs, slowing demand and higher financing costs.
- Risks to our bearish case are inflation falling quicker than expected and consumer demand holding up, especially in China.

Tesla (TSLA) has been a stellar performer for investors over the past number of years, but recent events both from a macroeconomic perspective and company-specific viewpoint are leading investors to question the investment thesis and relative valuation of Tesla. In this deep dive view, we propose a discounted valuation of Tesla as well as a relative comparison and skew our model to include varying scenarios. Our base case assumes a valuation of close to $400 per share, meaning at the current level Tesla is still considerably overvalued.
Update: We have ammended the price targtet from $400 to $133 to account for the 3 for 1 share split on August 25.
Tesla history and background
Tesla is headquartered in Austin, Texas, and is involved in manufacturing and distributing electric vehicles and energy storage systems. Tesla was founded in 2003 by Martin Eberhard and Marc Tarpenning in California. Elon Musk did not join the company until 2004 and became chairman in 2008. Tesla launched its first car, the Roadster, in 2008, which was met with a positive reaction, but the technology and charging time was a significant drawback. Tesla launched its IPO in June 2010 with the stock price debuting at $17 per share, raising $226 million for the company. Tesla did not make its first profit until 2013.
Since then Tesla has expanded its business into other so-called green energy initiatives, but the electric vehicle business remains its core. Tesla produces two main models of electric vehicles, the Model S and the Model 3. The Roadster was discontinued in 2012. 2020 saw a massive share price appreciation in Tesla (TSLA) stock as it soared from $400 to nearly $1,000.
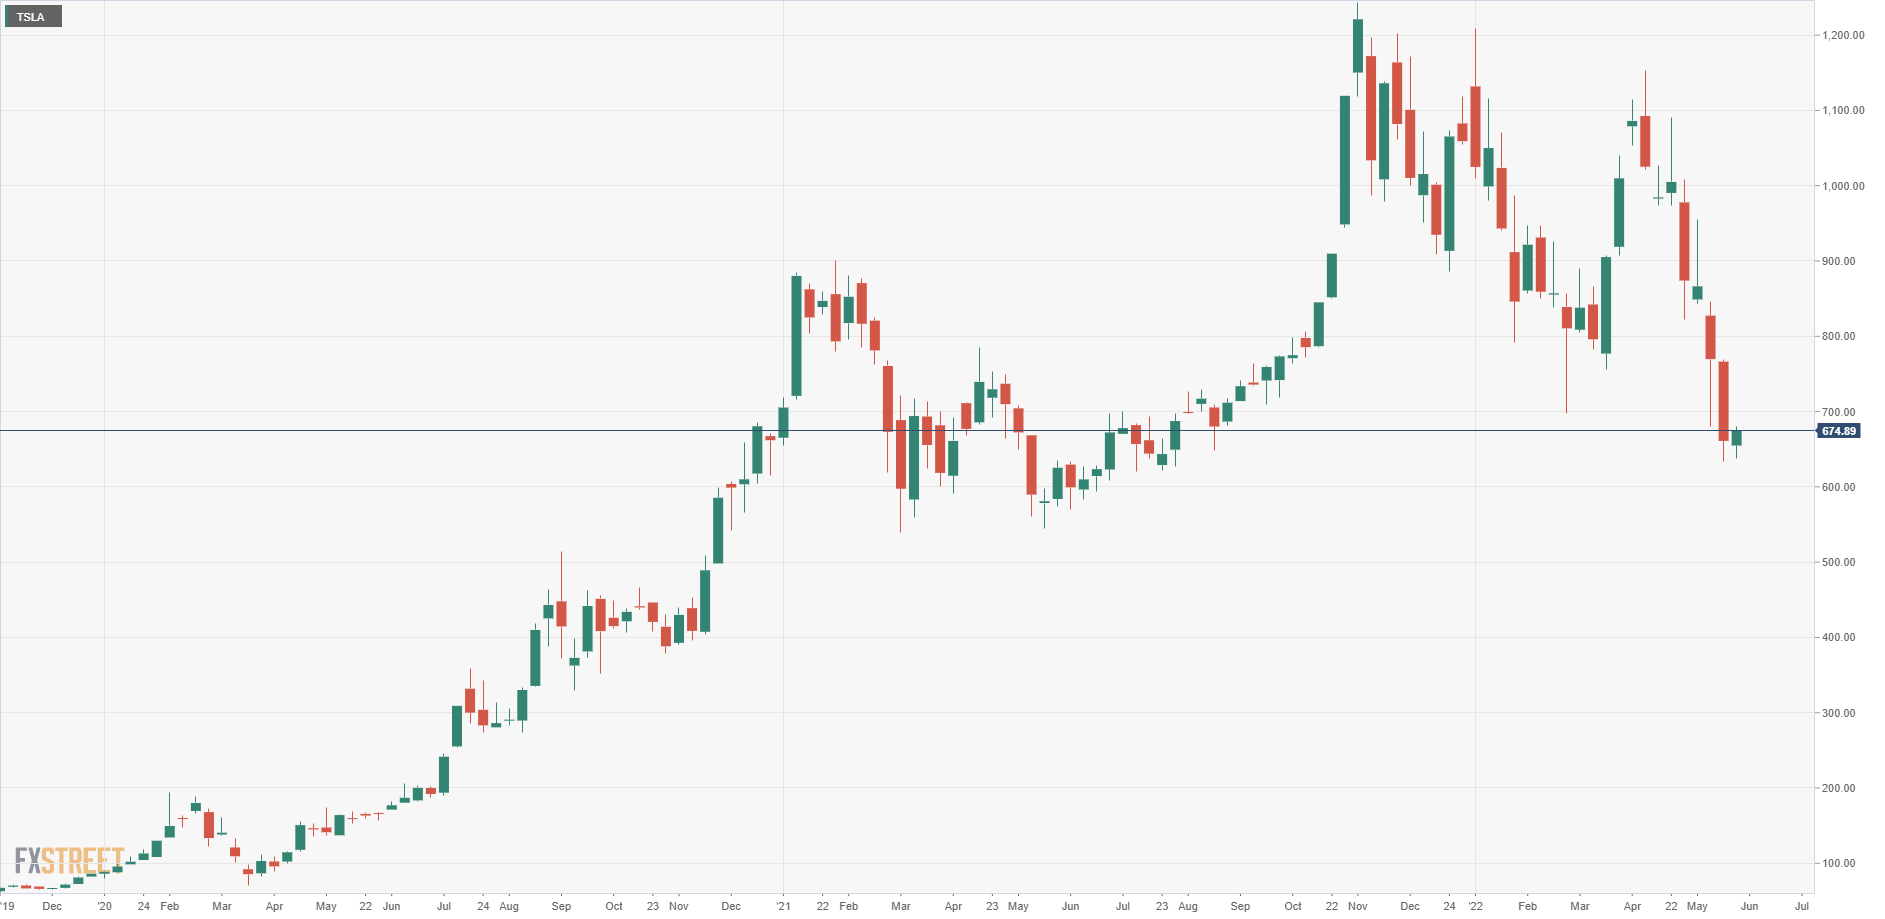
Tesla share price, 2020 to current
Tesla key info
| Market cap | $700 billion |
| Enterprise value (EV) | $1.237 trillion |
| EV/EBITDA | 126 |
| Free float | 857 million shares |
| IPO date | 9 June 2010 |
| 52-week high | $1,243.9 |
| 52-week low | $571.22 |
| Short Interest | 2.3% |
Read more on electric vehicle (EV) stock research
Tesla valuation ratio versus peers
We have detailed the standard auto company comparisons to include legacy automakers as well as noted Chinese EV makers NIO and BYD. We also include a comparison versus tech companies Apple and Google as Tesla is partly a tech company and deserves a higher multiple than traditional automakers. We include S&P 500 and Nasdaq P/E averages.
| Tesla | GM | Ford | VW | BYD | NIO | Apple | S&P 500 | Nasdaq | ||
| Market cap | $700b | $52b | $52b | $86b | $118b | $28b | $1.5t | $2.3t | ||
| Gross margin | 27% | 13% | 12% | 19% | 11% | 19% | 57% | 43% | ||
| Free cash flow | $7b | -$3.7b | $4b | $20b | $7.8b | - | $69b | $106b | ||
| P/E | 90 | 6 | 4 | 5 | 203 | - | 20 | 22 | 20 | 25 |
| EV/EBITDA | 126 | 8 | 16 | 6.5 | 30 | - | 20 | 21 | ||
| Price/Book | 23 | 1 | 1 | 0.7 | 7 | 4 | 6 | 36 | ||
| Price/Sales | 14 | 0.4 | 0.3 | 0.4 | 3 | 5 | 6 | 6 |
While Tesla looks obviously overvalued versus legacy automakers, it offers higher profitability and margins in the sector. Even compared with big tech companies, it remains highly valued versus Apple and Google.
Macroeconomic background and market cycle
Tesla is a high-growth stock and operates as mentioned at an extremely high valuation. Stock markets are forward-looking, and high valuations such as price/earnings (P/E) are not unusual for high-growth companies. However, the macroeconomic backdrop needs to be accommodative to such valuations and growth rates. The US has witnessed increasingly loose fiscal and monetary policies since the Global Financial Crisis (GFC) in 2008. This accelerated with the covid pandemic in 2020 and led to equity valuations and other high-risk assets reaching record highs.
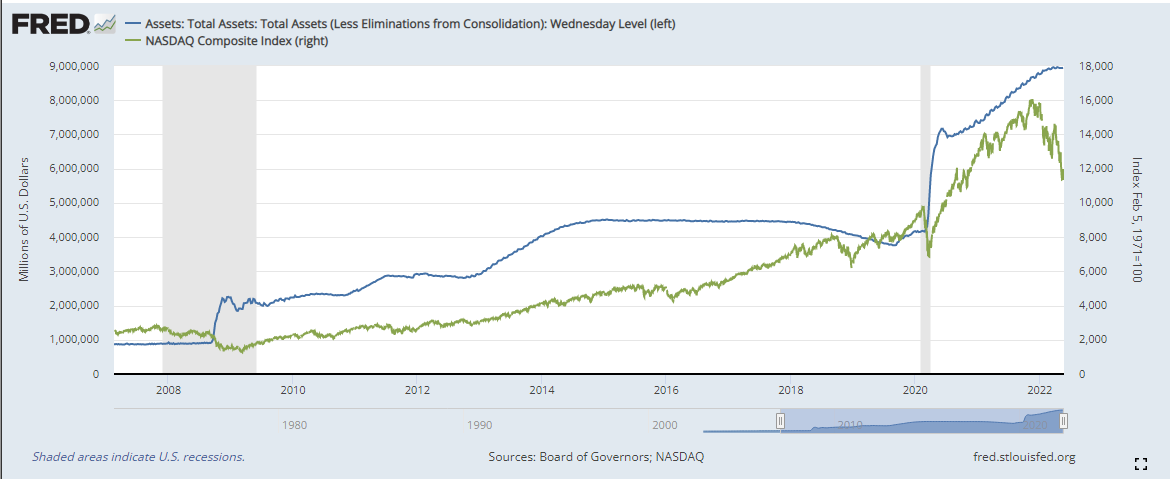
Chart Fed balance sheet vs Nasdaq since 2008.
However global central banks have now begun tightening monetary policy in the face of rising inflation. This has obvious implications for risk assets, and 2022 has seen a marked reduction in the price of such assets ranging from crypto to NFTs to high growth equities. This situation is not likely to change in the foreseeable future. Inflation will take time to return to reasonably acceptable levels, and central banks have huge balance sheets that need to be reduced gradually.
The US equity market peaked in January and since then has fallen by just under 20% for the benchmark S&P 500, while the high growth Nasdaq is down 27% in 2022. By traditional metrics, the S&P 500 will soon enter a bear market, while the Nasdaq is well-established in a bear phase. The average bear market results in a peak to trough decline of 40% and lasts approximately 300 days. Bear markets that are not accompanied by a US economic recession are notably shorter with drawdowns closer to 25%. By either metric though, there is likely more pain to come for equities for the remainder of the year.
-637891492321522346.png)
Tesla share price versus S&P 500 and Nasdaq. Percentage performance in 2022.
Tesla recent news and earnings
The Tesla share price has been under continuous pressure for the past three months. This has been due to macroeconomic factors as mentioned above and potential headwinds from Tesla’s Giga Shanghai factory being shuttered due to covid lockdowns in the city. Recent car delivery data from the China Car Passenger Association showed Tesla sales dropping 98% MoM. Tesla also did not export any China-made vehicles in April. However, the factory is now operational once again, and Tesla has relaunched exports from the plant. China is also embarking on a loosening of monetary policy in the wake of slowing economic growth and will also look at extending its EV credits. China is the world's largest EV market.
Tesla last reported earnings on April 20 and posted a significant beat versus analyst estimates. Revenue was $18.75 billion, 5% ahead of average estimates, while earnings per share (EPS) were $3.22 versus the $2.26 estimate. This marked the fourth straight quarter that Tesla has beaten estimates on the top and bottom lines. Tesla will next report earnings on July 25, 2022.
The recent "will-he-won't-he" Twitter takeover saga has been a serious headwind to Tesla. Initial reports and filings suggested up to $12.5 billion in financing would necessitate Tesla CEO Elon Musk pledging up to $60 billion of Tesla stock as collateral. Subsequent backing from investors reduced this loan to $6.25 billion, but Tesla shareholders were still more acutely aware than ever that Elon Musk has reportedly pledged up to 85 million Tesla shares over various terms and time horizons. Pledging additional Tesla shares as collateral increases the risk of shares being called back in the event of a significant Tesla share price decline.
Tesla valuation and peer analysis
There are two main valuation methods in corporate finance to find a fair value for any stock. Those are discounted cash flow (DCF) analysis and relative valuation. DCF aims to predict future cash flows and discount them back to a present value. Dividing this present value by the number of shares will then give a target share price. The second method is to compare relative valuations across industries and sectors. So using traditional metrics like price/earnings (P/E), price/sales and enterprise value/earnings before interest tax depreciation and amortization (EV/EBITDA). We will use both methods to come up with our target price and fair value for Tesla. All data is based on Refinitive data detailed at the end of the article for historical cash flows and predicted future cash flows out to 2024.
| Tesla free cash flows | |||||||
|---|---|---|---|---|---|---|---|
| 2019 | 2020 | 2021 | 2022 | 2023 est | 2024 est | terminal | |
| EBITDA | 2,983 | 5,817 | 11,621 | 20,487 | 27,603 | 34,811 | |
| EBIT | 829 | 3,728 | 8,644 | 16,673 | 24,141 | 31,301 | |
| Tax rate | 47% | 12% | 8% | 15% | 19% | 21% | |
| EBIT (1-t) | 1,581 | 5,119 | 10,691 | 17,414 | 22,358 | 27,501 | 0 |
| D&A | 2,154 | 2,322 | 2,197 | 4,414 | 5,757 | 4,704 | |
| NWC | -1,436 | -12,469 | -7,395 | -7,595 | -3,433 | -2,744 | 0 |
| Capital expenditures | 1,432 | 3,232 | 6,514 | 7,036 | 7,247 | 7,692 | |
| Unlevered free cash flows (UFCF) | -569 | 12,034 | 9,375 | 13,559 | 12,787 | 17,849 | |
| Free cash flow forecasts | 968 | 2711 | 3483 | 9763 | 13964 | 15332 | |
| Discount rate (r) | 10% | 10% | 10% | 10% | 10% | 10% | |
| PV of UFCFs | 10,831 | 8,438 | 12,203 | 11,509 | 16,064 | - | |
| Stage 1: Sum of present values | 59,044 | ||||||
| Growth in perpuatiy valuation | Using Forecast FCF | ||||||
| growth rate | 7% | 7% | |||||
| 2024 UFCF | 19,098 | 16,405 | |||||
| termival value in 2024 | 636,603 | 546,841 | |||||
| Present Value of Terminal Value | 395,281 | 339,545 | |||||
| Enterprise value | 454,324 | 339,545 | |||||
| current net debt | 20487 | 20487 | |||||
| shares outstanding | 856.8 | 856.8 | |||||
| equity value | $506 | $372 | |||||
| EBITDA Multiple approach | |||||||
| ebitda multiple | 20 | ||||||
| terminal value in 2024 | 696,220 | ||||||
| PV of term value | 432,298 | ||||||
| ent value | 491,342 | ||||||
| net debt | 20,487 | ||||||
| shares outstanding | 857 | ||||||
| equity value | $550 |
Source: FXStreet calculations
For those not fully familiar with the discounted cash flow approach (DCF), a brief explanation. As mentioned we use historical and predicted future cash flows to create a trend of growth. At some stage though, we have to assume a constant growth rate once the company (like any) moves from its hyper-growth phase into a steady stable growth rate into perpetuity. Traditionally, this growth rate would be modest and in line with inflation or the 30-year bond for example. Given Tesla's high growth rate and the growth rate of the entire EV industry, we have used a much higher 7% rate of growth than the industry standard of 4% or 5%. This is then used to calculate the terminal value. This is essentially the lump sum future value beyond the forecast period. We then return the sum of future and terminal values to the present value.
Also read: GGPI stock sets June 22 to approve Polestar merger
However, using the growth into perpetuity approach means we have to essentially guesstimate the long-run growth rate. Another approach is to use the current EV/EBITDA multiple or the EV/EBITDA of the sector or peer group. We then assume this will be relatively constant for the last year of the forecast. For this, we have compared Tesla to the tech sector rather than the auto sector. Tesla straddles both tech and auto, but for now it is more innovative as is the EV space in general, so we assign the higher EV/EBITDA tech multiple.
As can be seen above, using the EV/EBITDA multiple approach gives us a fair value of $550 per share while using the growth in perpetuity gives us a fair value of $506 per share.
Tesla relative valuation model
The more widespread valuation model used to compare stocks across sectors and industries is the relative valuation using traditional valuation ratios. For example, we can compare across different sectors based on price/earnings, price/sales or EV/EBITDA. This allows companies within the same sector to be compared. However, different sectors often will operate on vastly different multiples. This is due to the growth of the sector, the growth in average profitability of the sector and the maturity of the sector. It also regards the maturity of cash flows of companies within the sector. Obviously, the legacy auto sector is well-established, and companies trade at much lower multiples to the tech sector. We can see this below from the comparison table. The auto industry is labor intensive and not as flexible as tech, so hence the lower multiple for the sector overall.
| Tesla Relative Valuation | ||||
|---|---|---|---|---|
| Price/Earnings (P/E) | Price/Sales (P/S) | EV/EBITDA | ||
| Tesla | 90 | 14 | 126 | |
| GM | 6 | 0.4 | 8 | |
| Ford | 4 | 0.3 | 16 | |
| BYD | 203 | 3 | 30 | |
| 20 | 6 | 20 | ||
| Apple | 22 | 6 | 21 | |
| S&P 500 Avg | 20 | |||
| Nasdaq Avg | 25 | |||
| EV - enterprise value | ||||
| EBITDA - earnings before interest tax depreciation and amortization |
Source: Refinitiv and FXStreet calculations
We have also included the average ratios for the S&P 500 and Nasdaq as a whole. Using these multiples allows us to predict fair values for Tesla which we detail below.
| Tesla Share Price at above P/E multiples | ||||||||
|---|---|---|---|---|---|---|---|---|
| P/E 90 Tesla current | P/E of 5 GM Ford | P/E of 25 Nasdag Avg | P/E of 21 Apple | |||||
| Tesla share price using | ||||||||
| TTM earnings $6.78 eps | $610 | $33.9 | $169.5 | $142.38 | ||||
| Tesla share price using | ||||||||
| NTM earnings $12.31 eps | $1,107.9 | $61.55 | $307.75 | $258.51 | ||||
| TTM - trailing twelve months | ||||||||
| NTM - next twelve months |
Source: FXStreet calculations
Taking our various approaches into consideration results in four fair value assumptions for Tesla's share price.
| Tesla Share Price Valuations | ||||||
|---|---|---|---|---|---|---|
| Discounted Free Cash Flow Perp | $506 | using 7% growth rate-high by historical standards | ||||
| Discounted Free Cash Flow EV/EBITDA | $550 | using Apple, Google EV/EBITDA ratios | ||||
| Price/Earnings v's Apple | $259 | |||||
| Price/Earnings v's Nasdaq | $308 |
Source: FXStreet calculations
We now take our fundamental share price valuation and combine it with the technical overview for Tesla below.
Tesla technical analysis
We can clearly see the current strong downtrend dominating the Tesla stock price. A series of lower lows and lower highs. The key was breaking $975. Tesla found some initial support at the $700 area and has finally broken below to trade perfectly down to the next support at $620. This should see some short-term stabilization and lead to a bear market rally in our view. A move back up to $800 would not be unexpected in the next number of weeks. However, the long-term picture remains bearish as we outline in the weekly chart analysis.
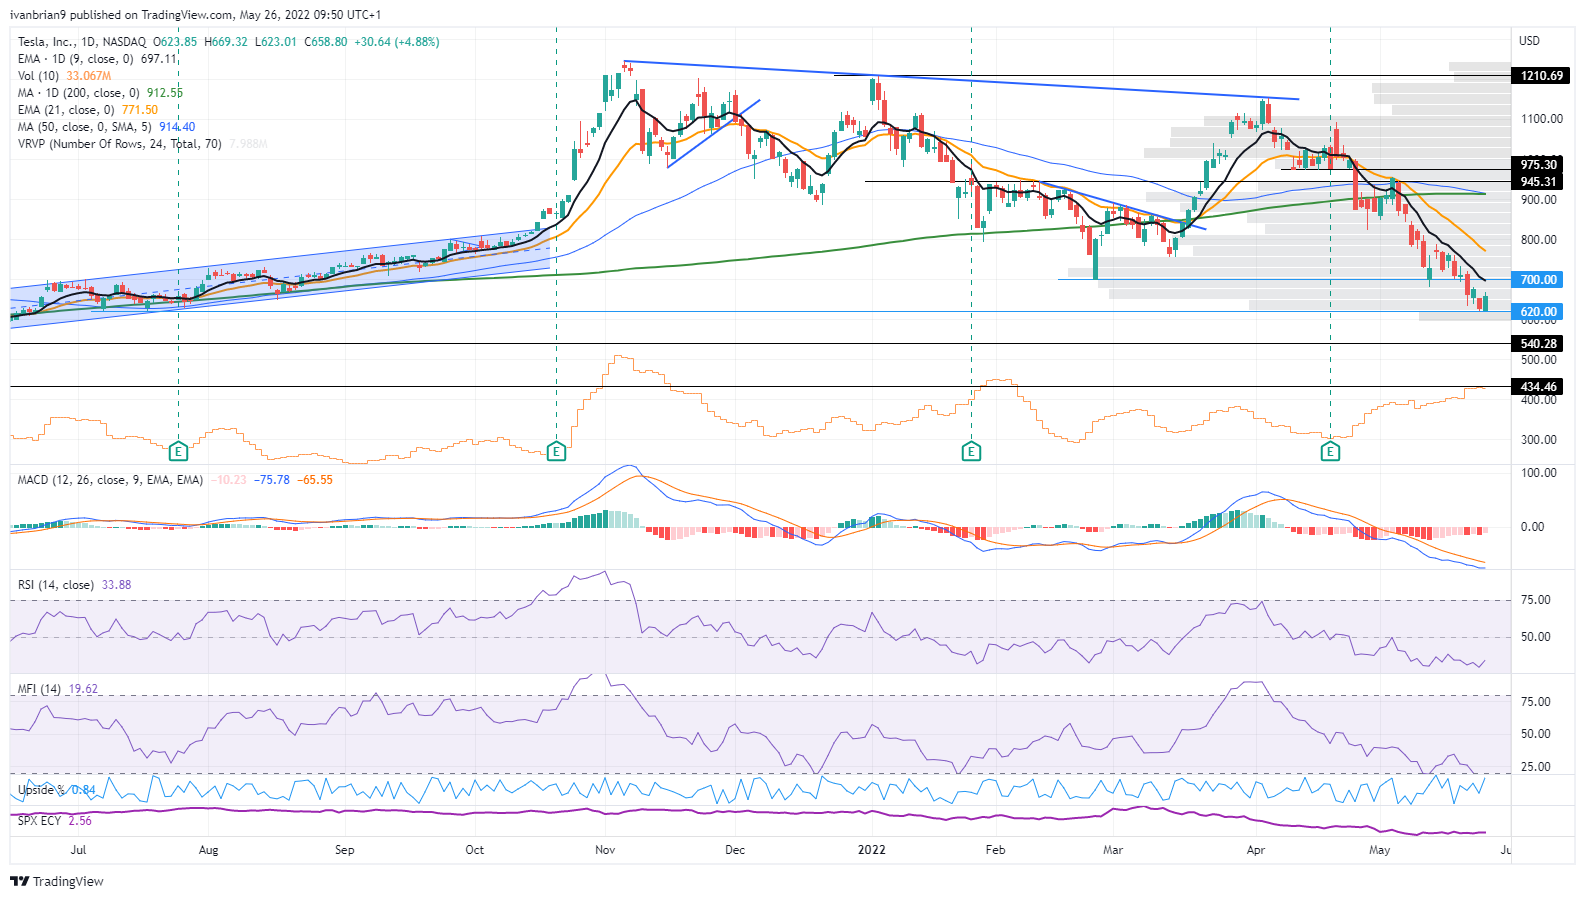
Tesla chart, daily
A very clear series leading to a long-term bearish narrative. We now have Tesla trading below all major moving averages with associated Moving Average Convergence Divergence (MACD) crossover. A volume gap beneath $620 could lead to a sudden capitulation to the bear target of $434. This is the long consolidation area from August 2020 until November 2020. That technical target is in line with the DCF and relative valuation price targets outlined above and gives us more comfort in our price target.
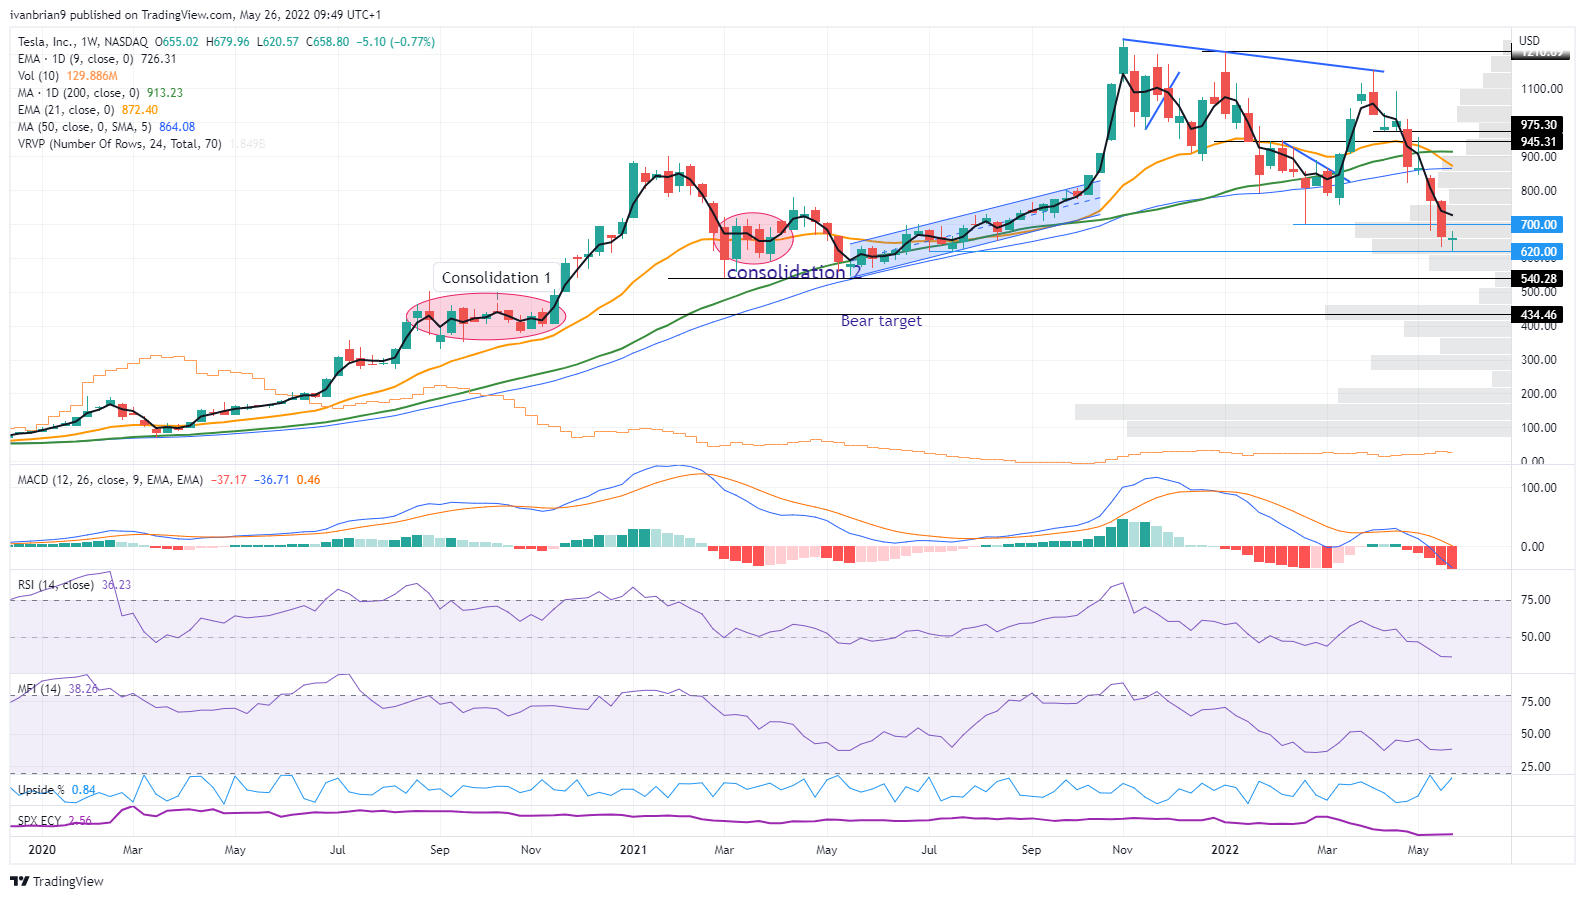
Tesla chart, weekly
Tesla price target and recommendation
Using all the valuations methods detailed above, we place a $400 price target on Tesla and a sell rating. All our models were based on average forecasts provided by Refinitiv and based on analyst and company guidance. We believe current forecasts are not yet fully incorporating the margin compression and delivery slowdown from the GIGA factory Shanghai slowdown. Media reports estimate that production is moving quickly back up to speed, but we still feel a reduction in year-end deliveries in the region of 10% is appropriate. Shanghai is Tesla's highest margin output, so in line with a reduction in deliveries will be a margin compression for FY2022. This is why we err to the lower side of our valuation forecasts.
Upside risks to our assumptions
- Shanghai production moves back to 100% quicker than expected.
- Inflation remains transitory.
- US, China and the global economy do not move into a recession by 2023.
- Fed reverses monetary tightening.
Downside risks to our assumptions
- Shanghai margins and production take a worse than expected hit.
- S&P 500 and Nasdaq remain in bear territory. An average bear market would see another 20% fall in the S&P 500.
- Consumer spending especially at the high end falls in the face of lasting inflation.
- Fed over tightens and raises rates too high.
Tesla reported earnings and forecast tables below, the foundation for all our DCF models. Data taken from Refinitiv (Reuters).
| Next Earning Report | ||||||||
|---|---|---|---|---|---|---|---|---|
| Tesla Income Statement and Forecast | ||||||||
| HISTORICAL (ACTUALS) | Forecast | |||||||
| FY 2022 | ||||||||
| FY Dec-19 | FY Dec-20 | FY Dec-21 | Q1 Mar-22 | FY Dec-22 | FY Dec-23 | FY Dec-24 | ||
| INCOME STATEMENT | ||||||||
| REVENUE | 24578.000 | 31536.000 | 53823.000 | 18756.000 | 86517.257 | 116096.639 | 137472.295 | |
| Guidance | T | T | T | - | T | T | - | |
| AUTOMOTIVE | 20821.000 | 27236.000 | 47232.000 | 16681.000 | 77201.309 | 101842.827 | 111262.013 | |
| ENERGY GENERATION AND STORAGE | 1531.000 | 1994.000 | 2789.000 | 616.000 | 3479.717 | 4705.675 | 6214.500 | |
| SERVICES AND OTHER | 2226.000 | 2306.000 | 3802.000 | 1279.000 | 5168.675 | 6396.950 | 7540.244 | |
| COST OF GOODS SOLD | 20509.000 | 24625.000 | 39796.000 | 12888.000 | 61886.470 | 84254.913 | 101573.627 | |
| GROSS INCOME | 4069.000 | 6911.000 | 14027.000 | 5460.000 | 23608.863 | 32531.203 | 37397.669 | |
| GROSS PROFIT MARGIN | 16.560% | 21.910% | 26.060% | - | 27.544% | 27.857% | 27.662% | |
| Guidance | T | T | T | - | T | - | - | |
| SG&A EXPENSE | 2646.000 | 2038.000 | 3265.000 | 848.000 | 5191.099 | 6837.573 | 7470.553 | |
| TOTAL COMPENSATION EXPENSE | 482.000 | 1107.000 | 1252.000 | - | - | - | - | |
| R&D EXPENSE | 1058.000 | 1145.000 | 2145.000 | 722.000 | 3748.985 | 4830.152 | 4705.084 | |
| STOCK BASED COMPENSATION | 898.000 | 1734.000 | 2121.000 | 418.000 | 1861.361 | 2217.006 | 2075.699 | |
| OPERATING EXPENSE | 4138.000 | 4636.000 | 5383.000 | 1857.000 | 8841.796 | 11297.220 | 12775.216 | |
| Guidance | T | T | T | - | T | - | - | |
| EBITDA | 2983.000 | 5817.000 | 11621.000 | 5023.000 | 20487.899 | 27603.486 | 34811.174 | |
| EBITDA PER SHARE | 3.248 | 5.370 | 10.289 | - | 18.781 | 24.514 | 28.915 | |
| DEPRECIATION | 2154.000 | 2322.000 | 2146.000 | 551.000 | 4162.220 | 5504.998 | 4452.497 | |
| EBITA | 80.000 | 3728.000 | 8695.000 | - | 16244.000 | 22463.500 | 26108.500 | |
| AMORTIZATION | 0.000 | 0.000 | 51.000 | - | 252.000 | 252.000 | 252.000 | |
| DEPRECIATION & AMORTIZATION | 2154.000 | 2322.000 | 2911.000 | 880.000 | 3857.388 | 4627.599 | 5220.943 | |
| EBIT | 829.000 | 3728.000 | 8644.000 | 4021.000 | 16673.733 | 24141.642 | 31301.620 | |
| OPERATING PROFIT | - | - | - | - | 16957.000 | 25984.000 | 47935.000 | |
| Guidance | T | T | T | - | - | - | - | |
| INTEREST EXPENSE | 685.000 | 748.000 | 371.000 | 61.000 | 212.989 | 237.056 | 235.980 | |
| PRE-TAX PROFIT | 233.000 | 2751.000 | 8464.000 | 4044.000 | 16146.806 | 22428.426 | 27423.868 | |
| TAX PROVISION | 110.000 | 327.000 | 685.000 | 346.000 | 2163.054 | 3510.413 | 4271.731 | |
| TAX RATE | 47.210% | 11.890% | 8.090% | 8.560% | 15.240% | 18.993% | 21.250% | |
| NET INCOME | 35.772 | 2424.000 | 7654.000 | 3731.000 | 14113.677 | 18601.287 | 20827.189 | |
| Guidance | - | - | - | - | T | - | - | |
| NUMBER OF SHARES OUTSTANDING | 885.000 | 1083.000 | 1129.000 | 1157.000 | 1152.185 | 1164.504 | 1169.261 | |
| EARNINGS PER SHARE | 0.040 | 2.240 | 6.780 | 3.220 | 12.311 | 15.908 | 17.776 | |
| EBITDA REPORTED | 2234.000 | 4316.000 | 9407.000 | 4483.000 | 19173.106 | 24901.436 | 26805.520 | |
| PRE-TAX PROFIT REPORTED | -665.000 | 1154.000 | 6343.000 | 3626.000 | 14241.952 | 20295.294 | 23203.282 | |
| NET INCOME REPORTED | -862.000 | 721.000 | 5519.000 | 3318.000 | 12798.610 | 17844.671 | 19463.775 | |
| EARNINGS PER SHARE REPORTED | -0.984 | 0.640 | 4.900 | 2.860 | 10.553 | 14.334 | 17.236 | |
| DIVIDEND PER SHARE | 0.000 | 0.000 | 0.000 | 0.000 | 0.000 | 0.000 | 0.000 | |
| BALANCE SHEET | ||||||||
| CASH AND CASH EQUIVALENTS | 6268.000 | 19384.000 | 17576.000 | 17505.000 | 24697.253 | 40128.093 | 57752.456 | |
| INVENTORY | 3552.000 | 4101.000 | 5757.000 | 6691.000 | 9160.583 | 10421.152 | 10809.352 | |
| CURRENT ASSETS | 12103.000 | 26717.000 | 27100.000 | 29050.000 | 39321.909 | 60235.500 | 83072.375 | |
| TOTAL ASSETS | 34309.000 | 52148.000 | 62131.000 | 66038.000 | 79211.923 | 103397.083 | 132874.400 | |
| CURRENT LIABILITIES | 10667.000 | 14248.000 | 19705.000 | 21455.000 | 25004.800 | 30519.111 | 33694.857 | |
| CURRENT DEFERRED REVENUE | 1163.000 | 1458.000 | 1447.000 | 1594.000 | 1594.000 | 1713.500 | 1851.000 | |
| LONG-TERM DEFERRED REVENUE | 1207.000 | 1284.000 | 2052.000 | 2185.000 | 2185.000 | 2513.000 | 2890.000 | |
| TOTAL DEBT | 13419.000 | 11688.000 | 6834.000 | 4812.000 | 5838.750 | 5082.500 | 5157.500 | |
| NET DEBT | 7151.000 | -7645.000 | -10873.000 | -13201.000 | -20487.387 | -33816.420 | -49844.311 | |
| SHAREHOLDERS EQUITY | 6618.000 | 22225.000 | 30189.000 | 34085.000 | 43328.504 | 60860.194 | 80545.345 | |
| GOODWILL | 198.000 | 207.000 | 200.000 | 200.000 | 329.000 | 329.000 | 323.500 | |
| NET ASSET VALUE | 7467.000 | 23075.000 | 31015.000 | 35406.000 | 42259.167 | 60200.000 | 82033.556 | |
| BOOK VALUE PER SHARE | 7.343 | 23.447 | 30.061 | 32.980 | 40.301 | 56.715 | 79.534 | |
| TANGIBLE BOOK VALUE PER SHARE | 6.718 | 22.898 | 29.606 | 32.541 | 39.059 | 53.734 | 61.070 | |
| ENTERPRISE VALUE | 114963.000 | - | 1082174.740 | - | 704581.641 | 695803.014 | 806899.911 | |
| TANGIBLE BOOK VALUE | 6081.000 | 21705.000 | 29732.000 | 33631.000 | 44975.060 | 59441.638 | 76801.228 | |
| CASH FLOW STATEMENT | ||||||||
| NET WORKING CAPITAL | 1436.000 | 12469.000 | 7395.000 | 7595.000 | - | - | - | |
| CASH FLOW FROM OPERATIONS | 2405.000 | 5943.000 | 11497.000 | 3995.000 | 16537.644 | 21915.532 | 24366.709 | |
| CAPITAL EXPENDITURES | 1432.000 | 3232.000 | 6514.000 | 1767.000 | 7036.644 | 7247.336 | 7692.970 | |
| Guidance | T | T | T | - | - | - | - | |
| CASH FLOW FROM INVESTING | -1436.000 | -3132.000 | -7868.000 | -2167.000 | -7976.375 | -8588.000 | -9994.571 | |
| FREE CASH FLOW | 968.000 | 2711.000 | 3483.000 | 2228.000 | 9763.691 | 13964.199 | 15332.149 | |
| FREE CASH FLOW PER SHARE | 1.100 | 2.500 | 4.410 | 1.930 | 9.750 | 12.680 | 15.220 | |
| TOTAL DIVIDENDS | - | - | 0.000 | 0.000 | - | - | - | |
| CASH FLOW FROM FINANCING | 1529.000 | 9973.000 | -5203.000 | -1914.000 | -1761.000 | -1264.750 | -1698.250 | |
| CASH FLOW PER SHARE | 2.718 | 5.490 | 10.180 | 3.450 | 15.985 | 18.418 | 22.445 | |
| VALUATION METRICS | ||||||||
| RETURN ON ASSETS | 0.110% | 5.610% | 13.400% | - | 21.986% | 23.940% | 16.700% | |
| RETURN ON EQUITY | 0.570% | 16.810% | 29.210% | 46.440% | 33.917% | 32.069% | 27.881% | |
| RETURN ON CAPITAL EMPLOYED | 0.500% | 9.840% | 18.760% | - | 26.700% | 26.800% | 24.750% | |
| RETURN ON INVESTED CAPITAL | 4.920% | 22.040% | 41.200% | 16.550% | 50.600% | 68.100% | 78.300% | |
| PRICE/SALES RATIO | - | - | - | - | 8.370% | 6.490% | 5.410% | |
| INDUSTRY KEY METRICS | ||||||||
Source: Refinitiv (Reuters)
The author is short Tesla and Twitter.
Like this article? Help us with some feedback by answering this survey:
Author

Ivan Brian
FXStreet
Ivan Brian started his career with AIB Bank in corporate finance and then worked for seven years at Baxter. He started as a macro analyst before becoming Head of Research and then CFO.


