Silver Price Forecast: XAG/USD gives up intraday gains after upbeat US JOLTS Job Openings
- Silver price becomes flat after the release of the better-than-expected US JOLTS Job Openings data for June.
- US employers posted fresh 8.18 million vacancies.
- The Fed is expected to leave interest rates steady for eighth straight time.

Silver price (XAG/USD) surrenders its intraday gains and falls slightly below $28.00 in Tuesday’s New York session. The white metal drops after the release of the better-than-expected United States (US) JOLTS Job Openings data for June. Fresh job vacancies came in higher at 8.18 million against expectations of 8.03 million but were lower than the prior release of 8.23 million, downwardly revised from 8.14 million.
Upbeat US JOLTS Job Openings data has pushed the US Dollar (USD) higher. The US Dollar Index (DXY), which tracks the Greenback’s value against six major currencies, jumps to near 104.80. 10-year US Treasury yields rebound to near 4.18%.
Meanwhile, the major trigger for the Silver price will be the interest rate decision by the Federal Reserve (Fed), which will be announced on Wednesday.
In the monetary policy meeting, investors expect that the Fed will decide to leave interest rates unchanged in the range of 5.25%-5.50%. The Fed is also expected to deliver a dovish guidance on interest rates.
According to the CME FedWatch tool, 30-day Federal Fund Futures pricing data shows that the central bank will reduce interest rates by 25 basis points (bps) from their current levels in the September meeting. The data also shows that there will be two rate cuts instead of one as projected by policymakers in the latest Fed dot plot.
Silver technical analysis
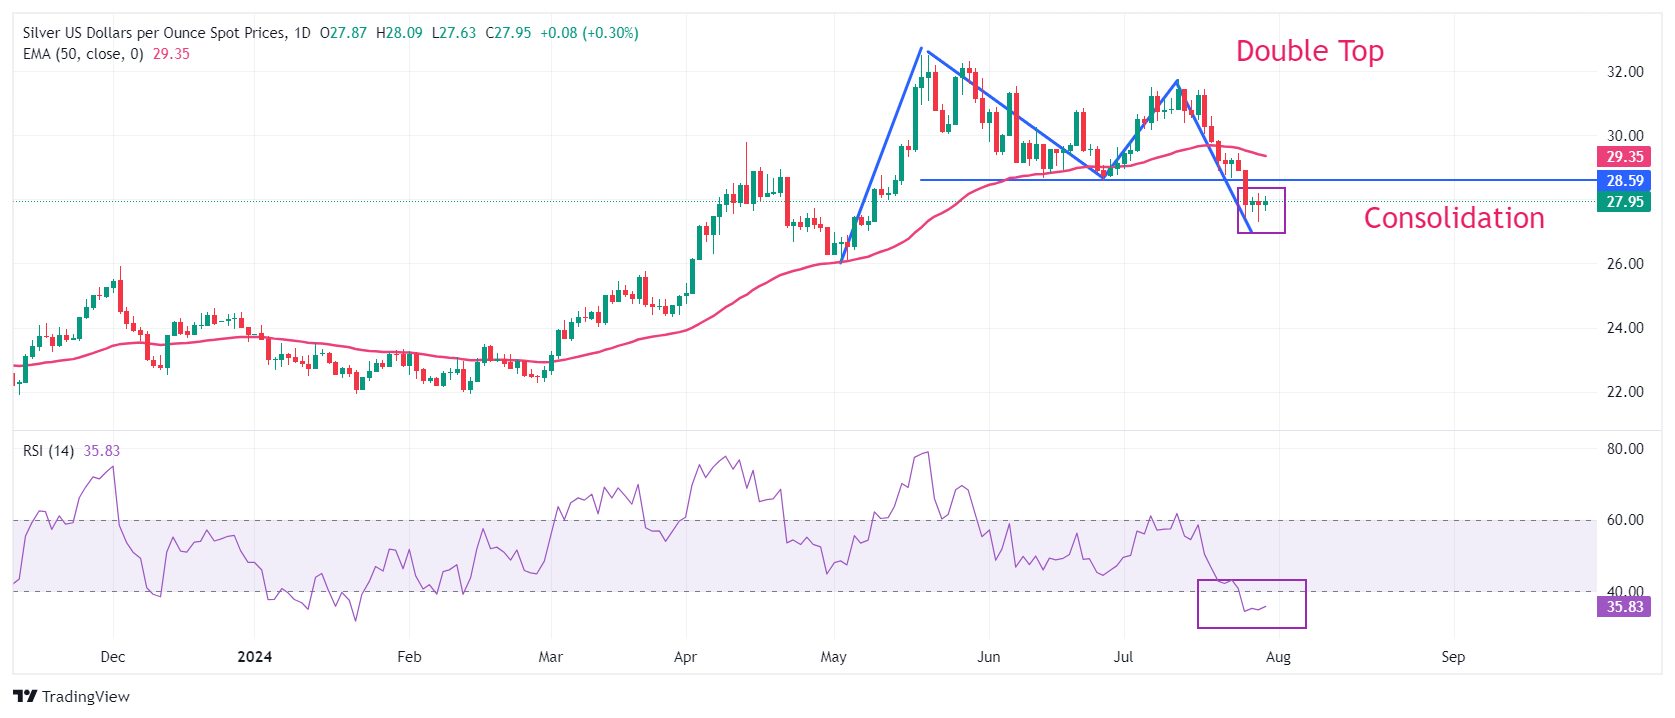
Silver price trades back and forth near $28.00. The near-term outlook of the Silver price turns bearish after a breakdown of the Double Top formation below June 26 low near $28.60 on a daily timeframe. A breakdown of the aforementioned chart pattern results in a bearish crossover. The overall trend of the Silver price is bearish as it establishes below the 50-day Exponential Moving Average (EMA), which trades around $29.35.
The 14-day Relative Strength Index (RSI) shifts into the bearish range of 20.00-40.00, suggesting that a bearish momentum is intact.
Silver daily chart
Silver FAQs
Silver is a precious metal highly traded among investors. It has been historically used as a store of value and a medium of exchange. Although less popular than Gold, traders may turn to Silver to diversify their investment portfolio, for its intrinsic value or as a potential hedge during high-inflation periods. Investors can buy physical Silver, in coins or in bars, or trade it through vehicles such as Exchange Traded Funds, which track its price on international markets.
Silver prices can move due to a wide range of factors. Geopolitical instability or fears of a deep recession can make Silver price escalate due to its safe-haven status, although to a lesser extent than Gold's. As a yieldless asset, Silver tends to rise with lower interest rates. Its moves also depend on how the US Dollar (USD) behaves as the asset is priced in dollars (XAG/USD). A strong Dollar tends to keep the price of Silver at bay, whereas a weaker Dollar is likely to propel prices up. Other factors such as investment demand, mining supply – Silver is much more abundant than Gold – and recycling rates can also affect prices.
Silver is widely used in industry, particularly in sectors such as electronics or solar energy, as it has one of the highest electric conductivity of all metals – more than Copper and Gold. A surge in demand can increase prices, while a decline tends to lower them. Dynamics in the US, Chinese and Indian economies can also contribute to price swings: for the US and particularly China, their big industrial sectors use Silver in various processes; in India, consumers’ demand for the precious metal for jewellery also plays a key role in setting prices.
Silver prices tend to follow Gold's moves. When Gold prices rise, Silver typically follows suit, as their status as safe-haven assets is similar. The Gold/Silver ratio, which shows the number of ounces of Silver needed to equal the value of one ounce of Gold, may help to determine the relative valuation between both metals. Some investors may consider a high ratio as an indicator that Silver is undervalued, or Gold is overvalued. On the contrary, a low ratio might suggest that Gold is undervalued relative to Silver.
Author

Sagar Dua
FXStreet
Sagar Dua is associated with the financial markets from his college days. Along with pursuing post-graduation in Commerce in 2014, he started his markets training with chart analysis.


