Silver Price Forecast: XAG/USD clings to gains near $30.50 as weak US data boosts Fed rate-cut bets
- Silver price exhibits strength near $30.50 amid firm Fed rate cut prospects.
- US ISM Services PMI expectedly contracted in June.
- Silver price strengthens after a Falling Channel breakout.

Silver price (XAG/USD) turns sideways near $30.50 in Thursday’s New York session after a strong upside move on Wednesday. The white metal stays quiet amid holiday in the United States (US) markets on account of Independence Day.
The white metal witnessed strong buying interest as market speculation for the Federal Reserve (Fed) to begin reducing interest rates from September strengthened further. The expectations for early Fed rates cuts grew due to weak US data.
On Wednesday, the ADP Employment data showed an unexpected decline in private payrolls for June, which indicated that the labor market strength is ebbing. In the same period, a sharp contraction in the ISM Services PMI suggested that the economy lost momentum in the second quarter.
The number of individuals hired by the private sector came in lower at 150K from estimates of 160K and the prior release of 157K. Meanwhile, the Services PMI, which represents the service sector that accounts for two-thirds of the economy fell to its lowest in four years. Also, New Orders contracted significantly and Prices Paid expanded at a slower pace.
Rising Fed rate cut bets have weighed heavily on the US Dollar. The US Dollar Index (DXY) has dropped to near 105.20.
Going forward, investors will shift focus to the US Nonfarm Payrolls (NFP) data for June, which will be published on Friday.
Silver technical analysis
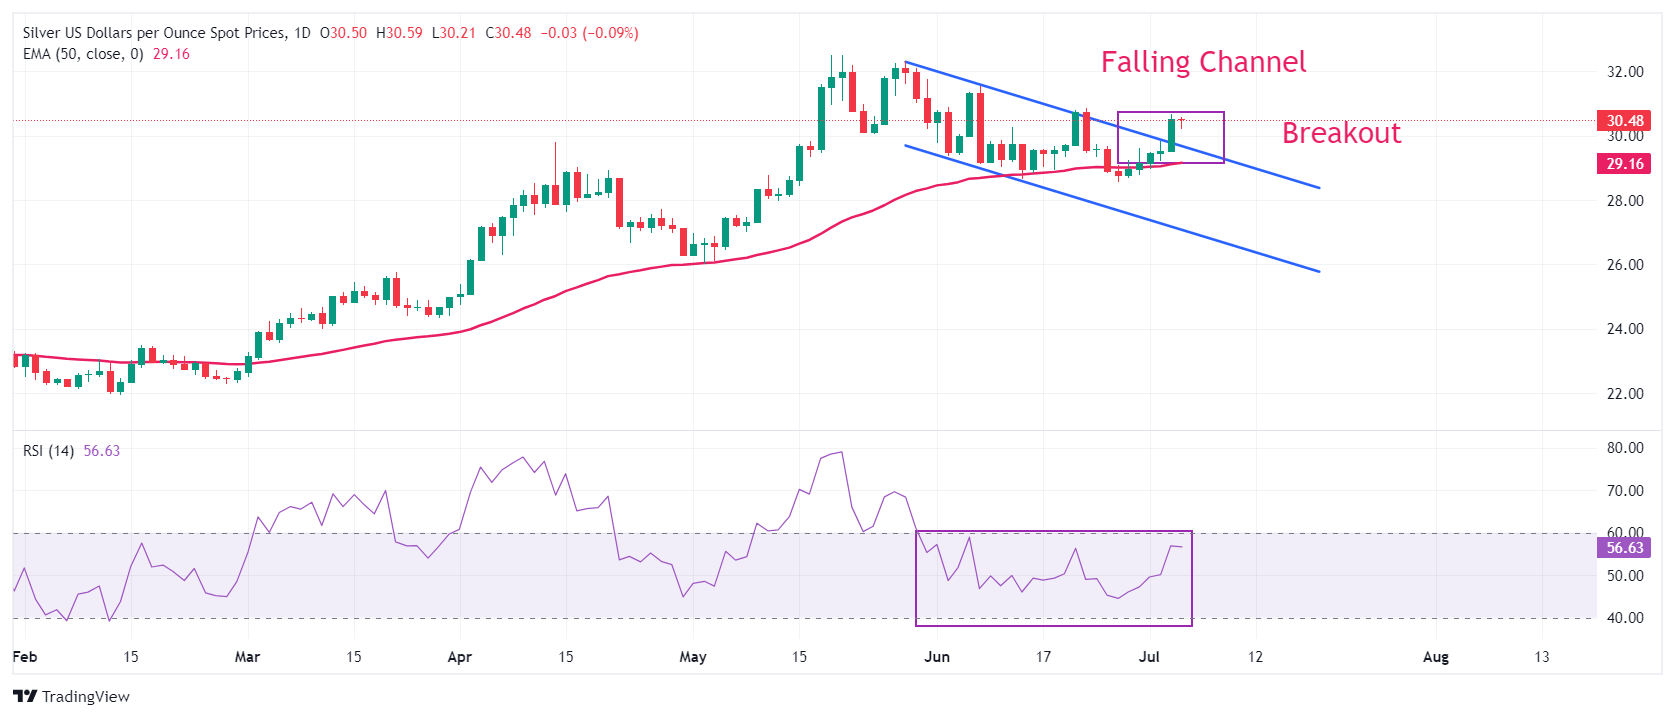
Silver price delivers a breakout of the Falling Channel chart formation on a daily timeframe. This suggests that a corrective move in the Silver price has now concluded and it has resumed its upside journey.
The white metal climbs above the 20-day Exponential Moving Average (EMA) near $29.60, suggesting that the near-term trend is bullish.
The 14-period Relative Strength Index (RSI) approaches 60.00. A decisive break above the same would shift momentum towards the upside.
Silver daily chart
Silver FAQs
Silver is a precious metal highly traded among investors. It has been historically used as a store of value and a medium of exchange. Although less popular than Gold, traders may turn to Silver to diversify their investment portfolio, for its intrinsic value or as a potential hedge during high-inflation periods. Investors can buy physical Silver, in coins or in bars, or trade it through vehicles such as Exchange Traded Funds, which track its price on international markets.
Silver prices can move due to a wide range of factors. Geopolitical instability or fears of a deep recession can make Silver price escalate due to its safe-haven status, although to a lesser extent than Gold's. As a yieldless asset, Silver tends to rise with lower interest rates. Its moves also depend on how the US Dollar (USD) behaves as the asset is priced in dollars (XAG/USD). A strong Dollar tends to keep the price of Silver at bay, whereas a weaker Dollar is likely to propel prices up. Other factors such as investment demand, mining supply – Silver is much more abundant than Gold – and recycling rates can also affect prices.
Silver is widely used in industry, particularly in sectors such as electronics or solar energy, as it has one of the highest electric conductivity of all metals – more than Copper and Gold. A surge in demand can increase prices, while a decline tends to lower them. Dynamics in the US, Chinese and Indian economies can also contribute to price swings: for the US and particularly China, their big industrial sectors use Silver in various processes; in India, consumers’ demand for the precious metal for jewellery also plays a key role in setting prices.
Silver prices tend to follow Gold's moves. When Gold prices rise, Silver typically follows suit, as their status as safe-haven assets is similar. The Gold/Silver ratio, which shows the number of ounces of Silver needed to equal the value of one ounce of Gold, may help to determine the relative valuation between both metals. Some investors may consider a high ratio as an indicator that Silver is undervalued, or Gold is overvalued. On the contrary, a low ratio might suggest that Gold is undervalued relative to Silver.
Author

Sagar Dua
FXStreet
Sagar Dua is associated with the financial markets from his college days. Along with pursuing post-graduation in Commerce in 2014, he started his markets training with chart analysis.


