Russell 2000 (IWM) Technical Forecast: Russell ends flat, Nasdaq lower but S&P and Dow break records
- Russell 2000, barely changes on Wednesday as volatility drops.
- Nasdaq retreats but is still overbought on RSI.
- IWM is stuck in a range and needs to move, forming a triple top.
Update after the close: It was hardly worth the effort to open the Russell as the broad index ETF closes less than a dollar higher, officially a gain of 0.01%, well I suppose they all count. The worries remain so stay tuned for some action, is this merely the calm before the storm? Certainly, worries are increasing as the put/call ratio increases over 11% on Wednesday. It is a good time to buy hedging/insurance or just plain bearish speculation as the VIX and hence put volatility is low.
Update: A probe lower to the 21-day moving average found some support just after the open on Wednesday but the picture still shows a lot of uncertainty. The Nasdaq remains overbought on the RSI but is at least not pushing higher so this may self-correct. VIX is calm and has not pushed on with recent gains but European markets are jittery as the delta variant is causing increasing concern there. Risks remain, delta variant, Nasdaq overbought on RSI, and what is looking increasingly like a bearish triple top here on the Russell 2000.
For a broader more comprehensive view of the market, the Russell 2000 (IWM) is a good proxy given it is made up of 2,000 stocks, while the Nasdaq and Dow are narrowly concentrated. The Dow is practically invitation only with just 30 stocks. The Nasdaq 100 has the top 100 non-financial companies that trade on its exchange, and even the S&P 500 is a bit narrowly focused with 500 stocks. Apologies if this is a bit obvious, but we try and cater to a broad range of traders here at FXStreet, and some may have shifted from FX and not be as familiar with the makeup of the main US equity indices.
Now that it is established that the Russell is the broadest measure of the overall US equity market, how is it performing? Frankly, it is lagging and needs to pull its socks up before it pulls everything down. The Nasdaq 100 has recently taken on a leadership role and outperformed the other main indices for June, reversing its underperformance earlier in the year. We have mentioned previously, but the inflation and yield fear that spooked markets has subsided. The US 10-year yield was heading for 2% but has now retreated and appears to be planning a quiet summer below 1.5%. The Fed did its best to convince markets that inflation will indeed be "transitory," to use its own language. Whether this pans out or not has yet to be seen and the latest inflation data, US PCE, and wholesale prices have hit multi-decade highs.
For now, markets have put inflation worries toward the back of their minds, which has allowed the interest rate sensitive Nasdaq 100 to surge. Apple (AAPL) had been slumbering but has recently put in a nice move (see here), and Tesla (TSLA) too has turned things around, surging through some key levels (see here). Facebook (FB) joined the $1-trillion-dollar club. Microsoft (MSFT) joined the $2-trillion-dollar club, and Alphabet (GOOGL) has set more record highs.
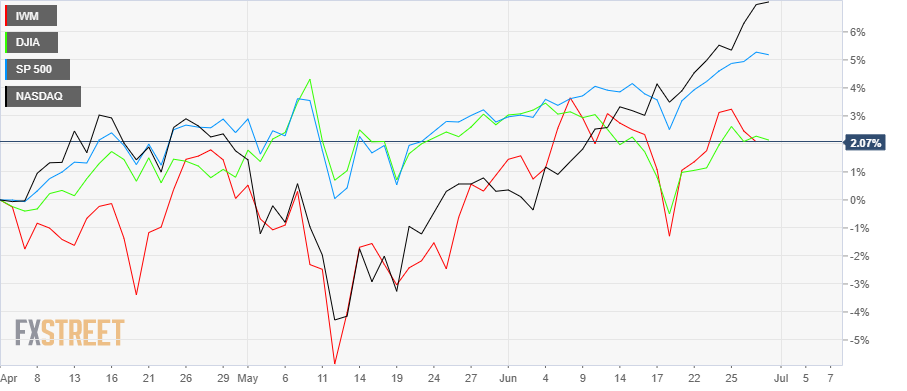
Can all this Nasdaq boom continue while other stocks and indices are left in the dust? The chart below shows us the relative performance of the main indices since April. The Russell (IWM) underperformed in May along with the Nasdaq 100, but by early June it had caught back up. This trend has resurfaced in late June for the Russell 2000, but the Nasdaq 100 has surged to new highs. So will the Russell play catch up or is it signaling to us that things are about to turn?
Russell 2000 (IWM) forecast
Just a quick word on the relative means of trading the Russell Index. For analysis, we are using the exchange-traded fund (ETF), ticker IWM, as opposed to using the futures contract, ticker RTY. Both are more or less mirror images.
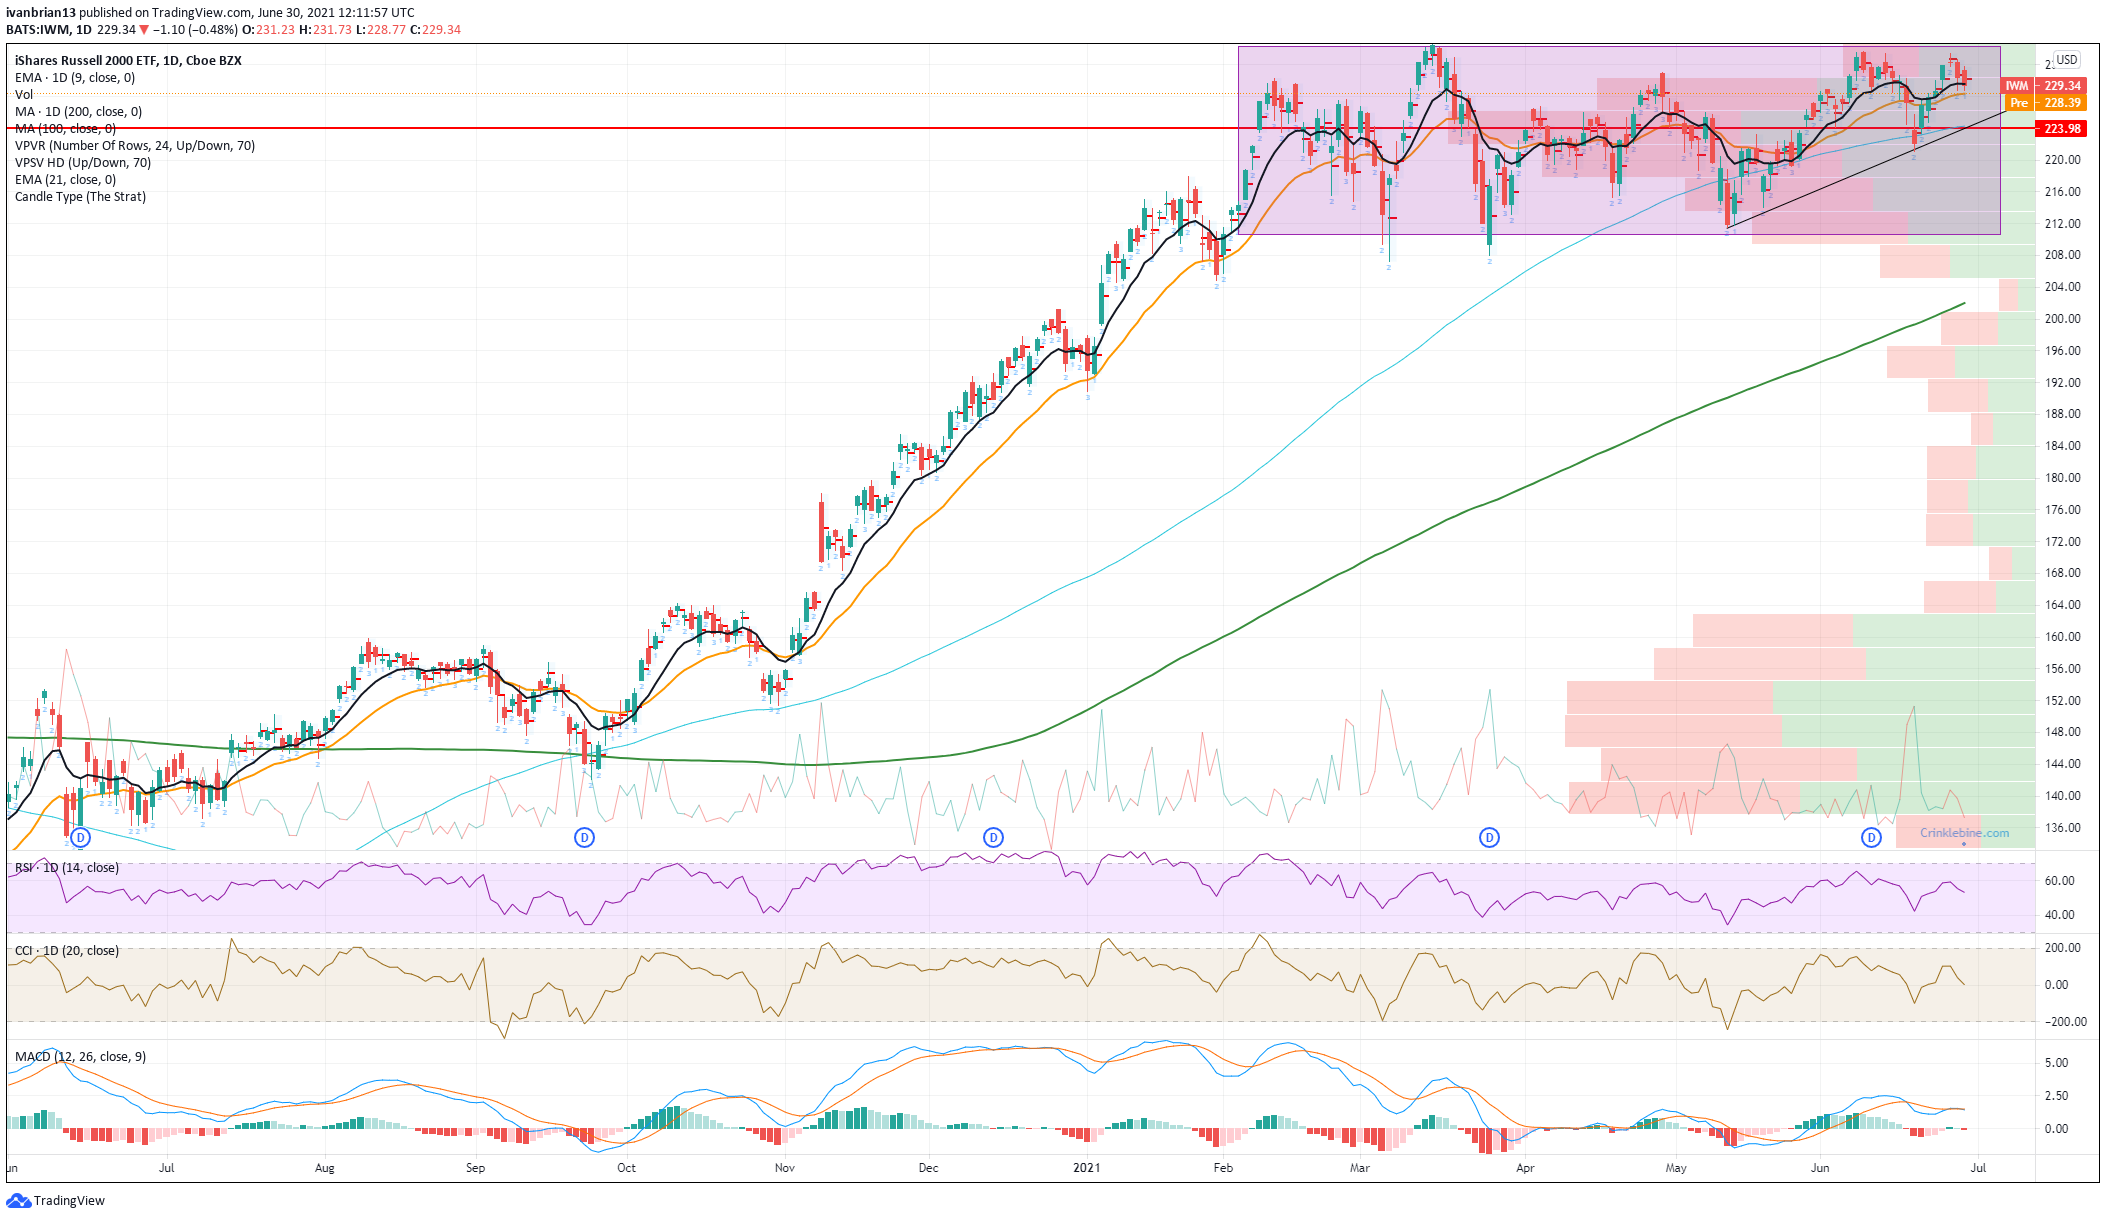
From the chart below we can see the large, effectively sideways range the Russell has traded in since the beginning of 2021. While the other indices have proudly been showing off regular new highs, the Russell appears unloved. This cannot continue forever. At some stage, something has to give. We pointed out in our analysis of the S&P 500 on Tuesday (see here) that the Nasdaq RSI (Relative Strength Index) had crept into overbought territory, and that remains the case. The delta variant is also growing in spread and causing fresh lockdowns in parts of Asia and a delay to reopening of economies in some EU countries. Finally, we identified the VIX at low slumbering levels, but Tuesday saw a modest 3% spike to 16.5 – not huge but worth watching.
There is no strong trend in evidence for the Russell 2000 to fall back on. The 9 and 21-day moving averages are flatlining, as is the MACD (Moving Average Convergence Divergence). The RSI is trending lower. Breakouts can be powerful trades to jump on, and if the Russell does manage it then expect a strong continuation. $234.53 remains the high and breakout level from March. A retracement to $205 could get ugly due to a lack of volume beneath. Putting in a retracement here would mean a bearish triple top.
Like this article? Help us with some feedback by answering this survey:
Author

Ivan Brian
FXStreet
Ivan Brian started his career with AIB Bank in corporate finance and then worked for seven years at Baxter. He started as a macro analyst before becoming Head of Research and then CFO.


